File:Timeline. Overdose death rates involving opioids, by type, United States.gif
(Redirected from File:Timeline. Overdose deaths involving opioids, United States.gif)
Size of this preview: 800 × 473 pixels. Other resolutions: 320 × 189 pixels | 640 × 379 pixels | 1,024 × 606 pixels | 1,280 × 757 pixels | 2,560 × 1,515 pixels | 5,379 × 3,183 pixels.
Original file (5,379 × 3,183 pixels, file size: 445 KB, MIME type: image/gif)
Captions
Captions
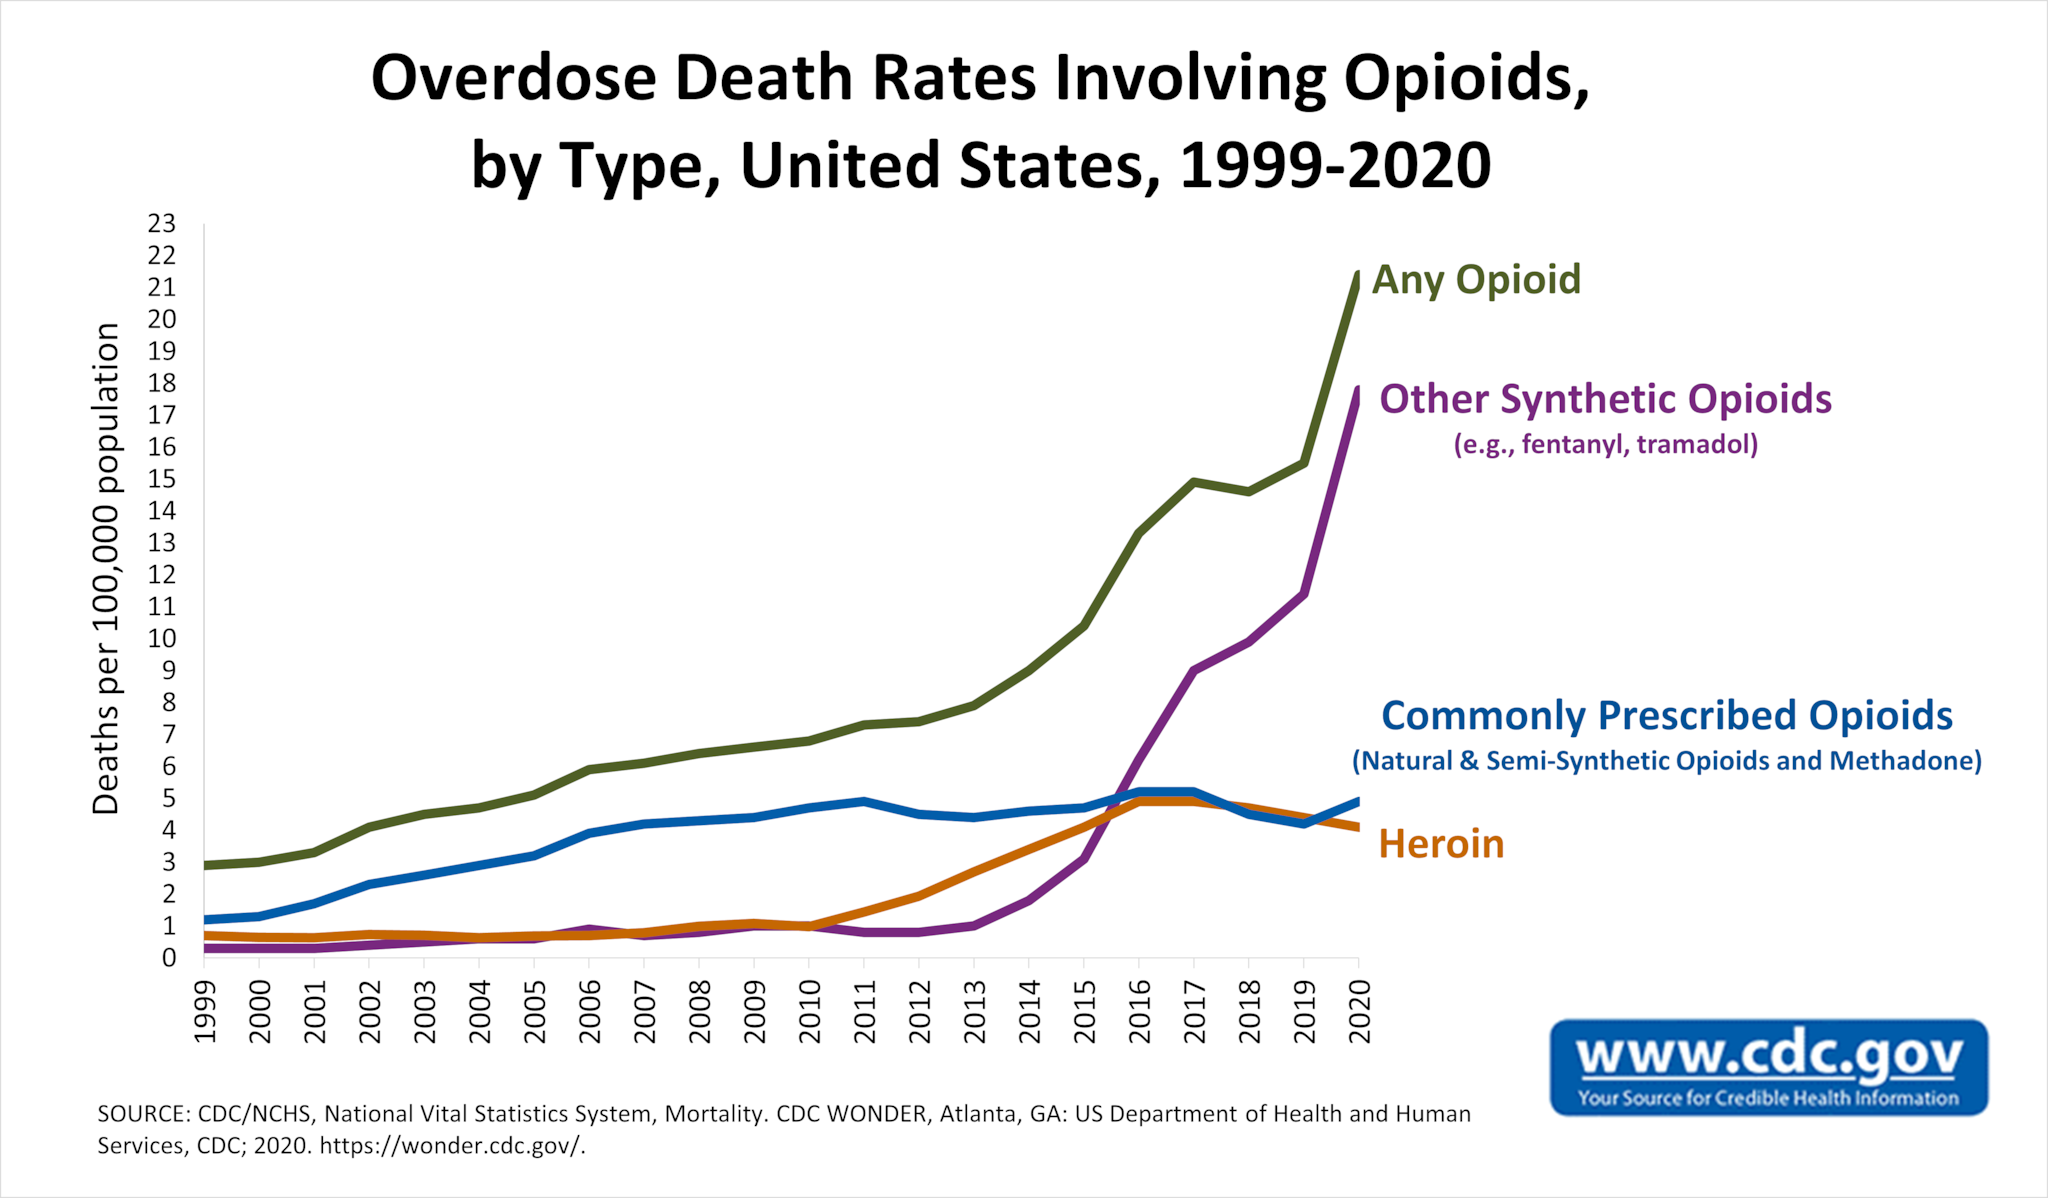
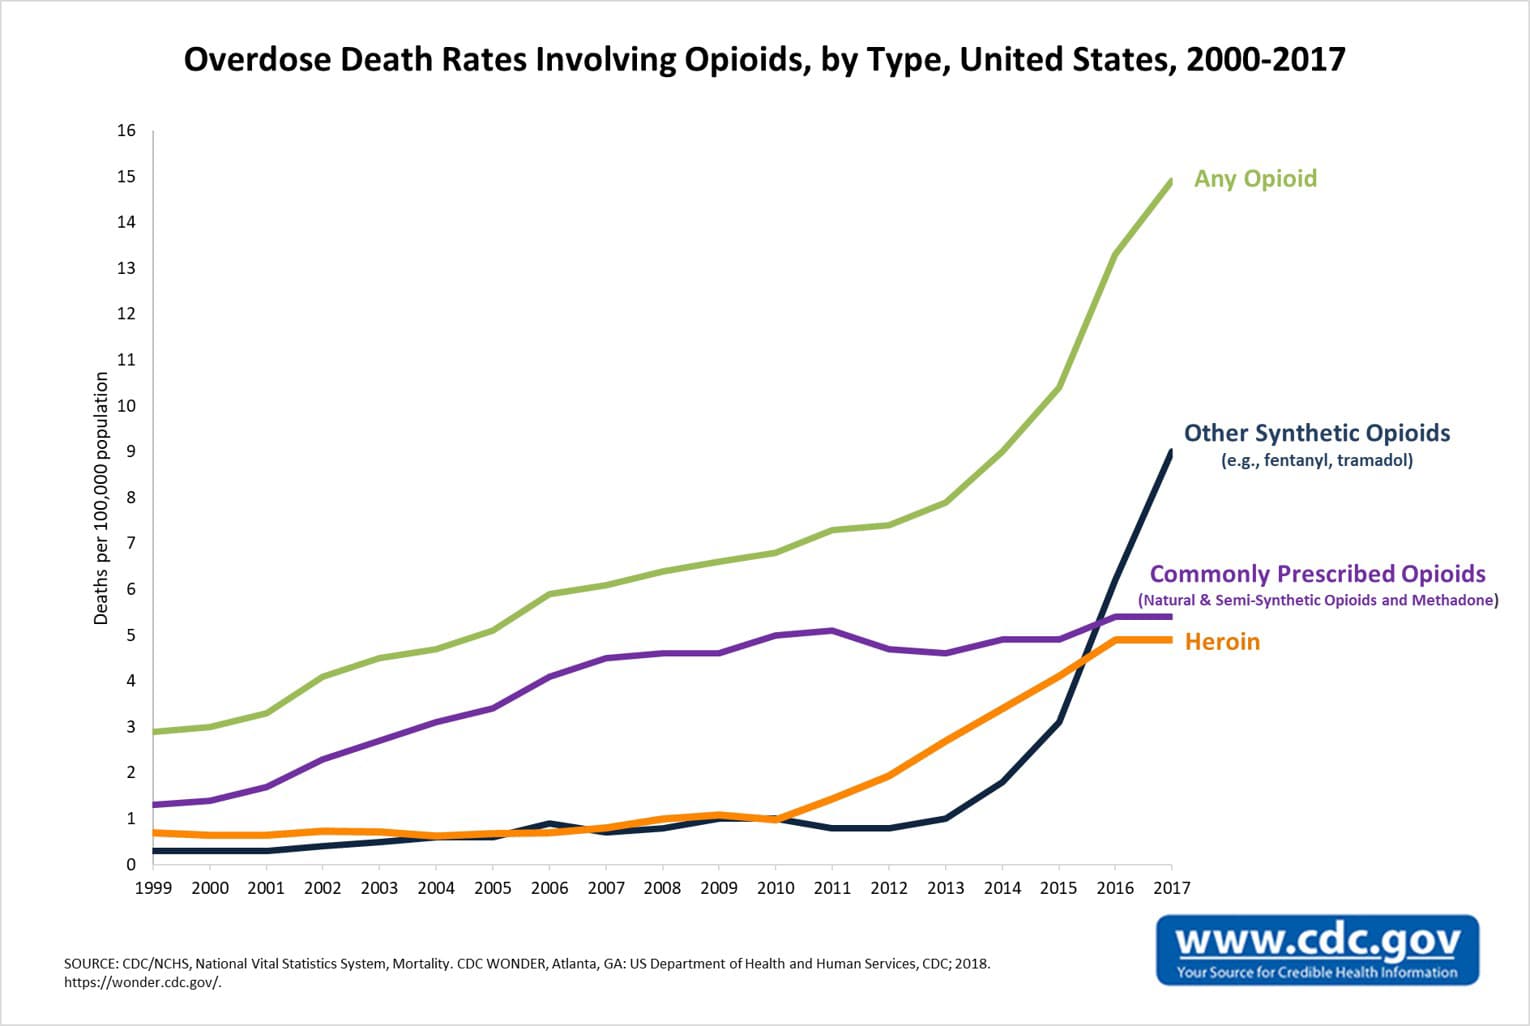
Timeline. Overdose deaths involving opioids, United States

|
This chart image could be re-created using vector graphics as an SVG file. This has several advantages; see Commons:Media for cleanup for more information. If an SVG form of this image is available, please upload it and afterwards replace this template with
{{vector version available|new image name}}.
It is recommended to name the SVG file “Timeline. Overdose death rates involving opioids, by type, United States.svg”—then the template Vector version available (or Vva) does not need the new image name parameter. |

|
This file may be updated to reflect new information. If you wish to use a specific version of the file without it being overwritten, please upload the required version as a separate file. |
Any autoconfirmed user can overwrite this file from the same source. Please ensure that overwrites comply with the guideline.
Summary
[edit]
| Description |
English: Timeline graph of overdose death rates involving opioids, United States. Deaths per 100,000 population. |
| Date | - Date the chart was first uploaded to the Commons. See file history for dates of later uploads. |
| Source | Opioid Data Analysis and Resources. CDC. Scroll down to "Trends in Death Rates" section. 1999-2020 chart. 1999-2019 chart. 1999-2018 chart. 2000-2017 chart. 2000-2016 chart. |
| Author | Centers for Disease Control and Prevention. On some versions the chart was cropped by User:Timeshifter. Freeware IrfanView was used to add a border, and to edit the caption text on the chart. |
| Other versions |
See: |
Licensing
[edit]
This image is a work of the Centers for Disease Control and Prevention, part of the United States Department of Health and Human Services, taken or made as part of an employee's official duties. As a work of the U.S. federal government, the image is in the public domain.
|
File history
Click on a date/time to view the file as it appeared at that time.
| Date/Time | Thumbnail | Dimensions | User | Comment | |
|---|---|---|---|---|---|
| current | 21:21, 24 February 2023 | | 5,379 × 3,183 (445 KB) | Timeshifter (talk | contribs) | Border added. |
| 21:17, 24 February 2023 |  | 5,357 × 3,197 (437 KB) | Timeshifter (talk | contribs) | Larger version | |
| 15:58, 24 February 2023 |  | 1,116 × 655 (96 KB) | Timeshifter (talk | contribs) | Cropped 6 % horizontally, 5 % vertically using CropTool with precise mode. | |
| 15:44, 24 February 2023 |  | 1,185 × 693 (102 KB) | Timeshifter (talk | contribs) | newer | |
| 12:24, 2 February 2022 |  | 1,133 × 627 (96 KB) | HerrAdams (talk | contribs) | Cropped 5 % horizontally, 4 % vertically using CropTool with lossless mode. | |
| 08:51, 7 December 2021 |  | 1,187 × 655 (102 KB) | Timeshifter (talk | contribs) | Latest graph from source. | |
| 00:07, 17 March 2021 |  | 1,097 × 679 (30 KB) | Timeshifter (talk | contribs) | Latest version. | |
| 19:08, 5 April 2019 |  | 1,427 × 874 (80 KB) | Timeshifter (talk | contribs) | User created page with UploadWizard |
You cannot overwrite this file.
File usage on Commons
The following 2 pages use this file:
File usage on other wikis
The following other wikis use this file:
- Usage on ar.wikipedia.org
- Usage on en.wikipedia.org
- Usage on eo.wikipedia.org
- Usage on et.wikipedia.org
- Usage on fr.wikipedia.org
- Usage on ga.wikipedia.org
- Usage on nl.wikipedia.org
- Usage on ru.wikipedia.org
- Usage on simple.wikipedia.org
- Usage on sv.wikipedia.org
- Usage on www.wikidata.org
- Usage on zh.wikipedia.org