File:Time-saving-bias.svg
Jump to navigation
Jump to search

Size of this PNG preview of this SVG file: 800 × 500 pixels. Other resolutions: 320 × 200 pixels | 640 × 400 pixels | 1,024 × 640 pixels | 1,280 × 800 pixels | 2,560 × 1,600 pixels.
Original file (SVG file, nominally 800 × 500 pixels, file size: 11 KB)
Captions
Captions
Add a one-line explanation of what this file represents
Summary
[edit]
| Description |
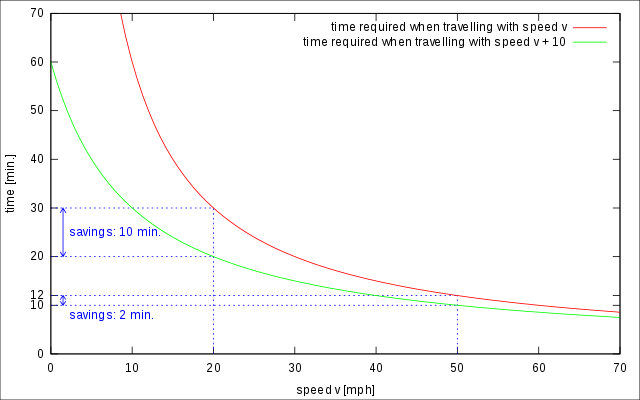
English: Illustration to an example given in article about time-saving bias: shows travel time for a distance of 10 miles for different velocity + when the speed is increased by 10 mph |
| Date | |
| Source | Own work |
| Author | Tbap |
Licensing
[edit]
I, the copyright holder of this work, hereby publish it under the following license:
This file is licensed under the Creative Commons Attribution-Share Alike 4.0 International license.
- You are free:
- to share – to copy, distribute and transmit the work
- to remix – to adapt the work
- Under the following conditions:
- attribution – You must give appropriate credit, provide a link to the license, and indicate if changes were made. You may do so in any reasonable manner, but not in any way that suggests the licensor endorses you or your use.
- share alike – If you remix, transform, or build upon the material, you must distribute your contributions under the same or compatible license as the original.
Gnuplot source
[edit]
set terminal svg dashed size 800,500
set output 'time-saving-bias.svg'
set object 1 rectangle from screen 0,0 to screen 1,1 fillcolor rgb"white" behind

#test
#set output

set xrange [0:70]
set yrange [0:70]

set ytics 10
set ytics add ("12" 12)

set xlabel "speed v [mph]"
set ylabel "time [min.]"

f(x) = 60 * (10 / x)
g(x) = 60 * (10 / (x + 10))

# draw guide lines:
set arrow 1 from 0,30 to 20,30 nohead lt 3
set arrow 2 from 0,20 to 20,20 nohead lt 3
set arrow 3 from 0,12 to 50,12 nohead lt 3
set arrow 4 from 0,10 to 50,10 nohead lt 3
set arrow 5 from 20,0 to 20,30 nohead lt 3
set arrow 6 from 50,0 to 50,12 nohead lt 3

# draw arrows:
set arrow 7 from 1.5,20 to 1.5,30 heads lt 1 linecolor rgb "blue" size 0.7, 30
set arrow 8 from 1.5,10 to 1.5,12 heads lt 1 linecolor rgb "blue" size 0.7, 30

# labels:
set label "savings: 10 min." at 2.2,25 textcolor rgb "blue"
set label "savings: 2 min." at 2.2,8 textcolor rgb "blue"

plot f(x) title 'time required when travelling with speed v' with lines linestyle 1, \
     g(x) title 'time required when travelling with speed v + 10' with lines linestyle 1 linecolor rgb "green"
File history
Click on a date/time to view the file as it appeared at that time.
| Date/Time | Thumbnail | Dimensions | User | Comment | |
|---|---|---|---|---|---|
| current | 14:21, 3 May 2018 | | 800 × 500 (11 KB) | Tbap (talk | contribs) | User created page with UploadWizard |
You cannot overwrite this file.
File usage on Commons
There are no pages that use this file.
File usage on other wikis
The following other wikis use this file:
- Usage on en.wikipedia.org