File:T-test vs equivalence test.png
Jump to navigation
Jump to search
Size of this preview: 800 × 449 pixels. Other resolutions: 320 × 180 pixels | 640 × 359 pixels | 1,024 × 575 pixels | 1,280 × 718 pixels | 2,889 × 1,621 pixels.
Original file (2,889 × 1,621 pixels, file size: 589 KB, MIME type: image/png)
Captions
Captions
t-test vs equivalence test
Summary
[edit]
| Description |
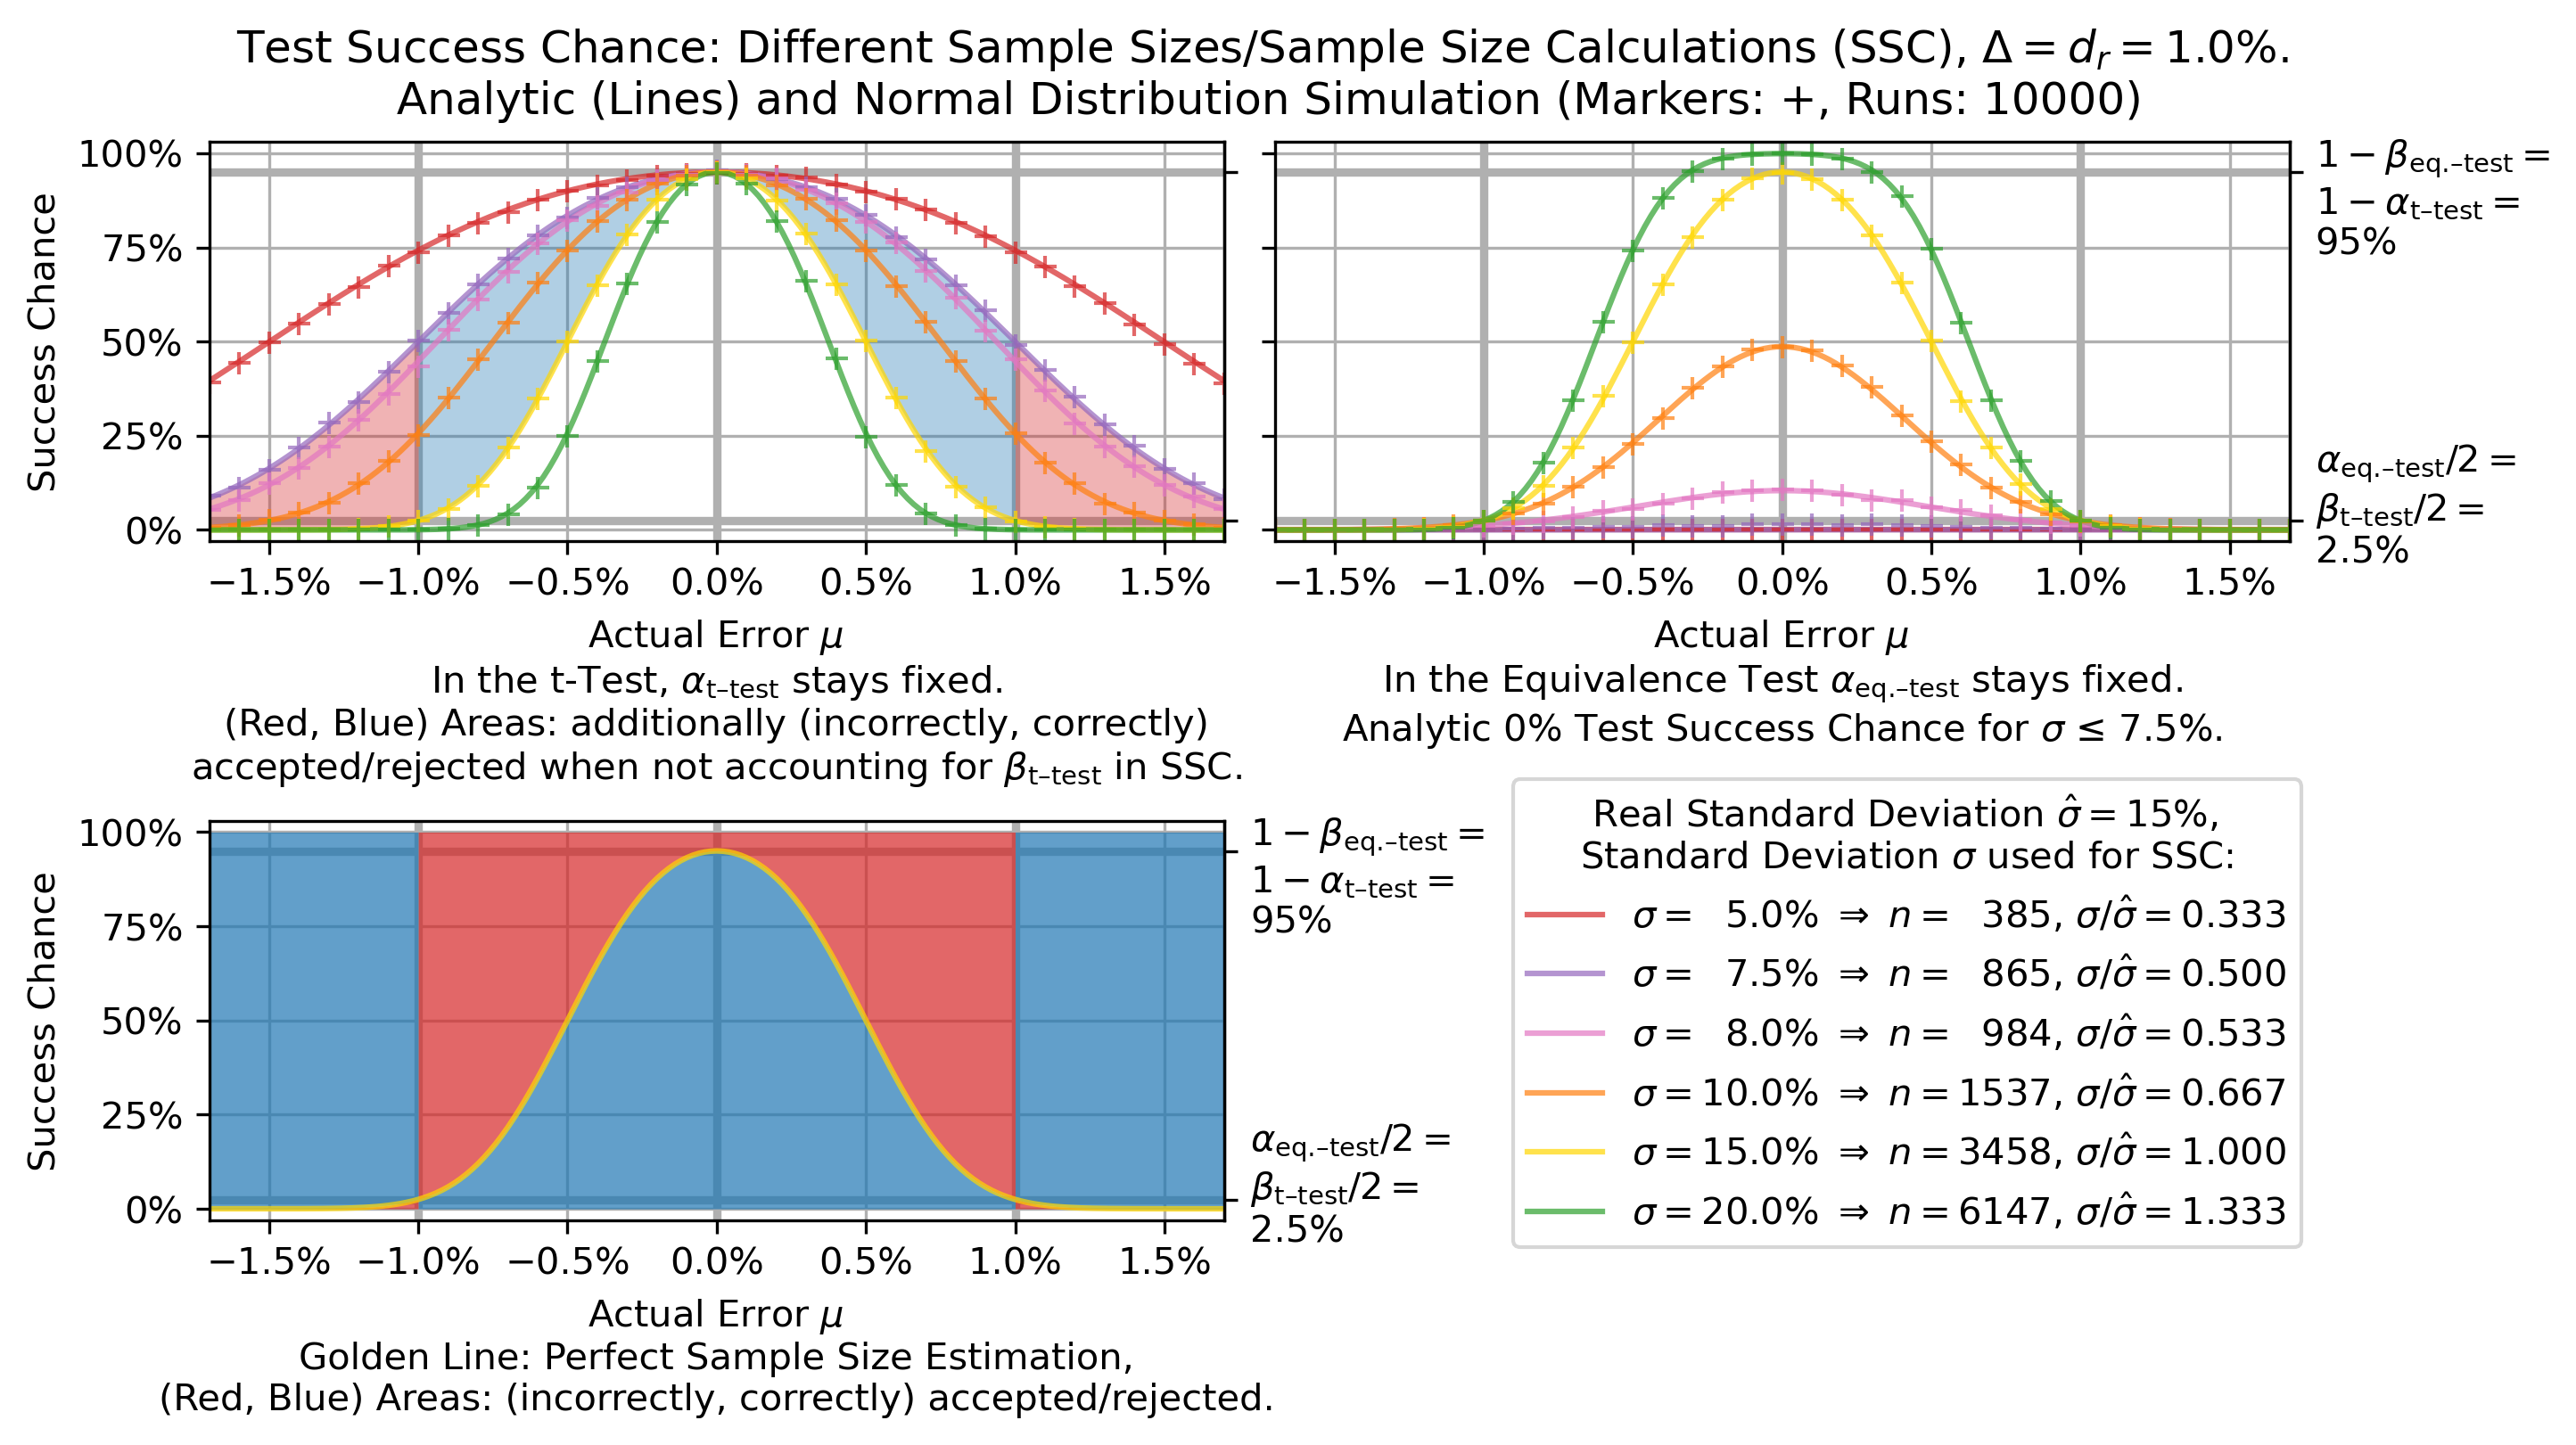
English: Chances to pass the t-test or the equivalence test depending on the actual error 𝜇. Different lines denote different sample sizes obtained from different a priori choices of the standard deviation σ. The golden, solid curve always represents a correctly estimated sample size, the green curve a sample which is too large and the other curves samples which are too small. Neglecting the t-test type II (or the equivalence test type I) error implies a power of 50%. The thick grey lines denote 𝛥=1%. For comparison: in the bottom graph, the incorrect decisions of a reference test are red, the correct decisions are coloured blue. The reason for red areas to exist are economic considerations to limit the test costs: further increasing the sample size towards infinity would make the red areas disappear, at least for the revised t-test or the equivalence test. For the t-test, the areas with systematic error 𝜇>1% and 𝜇<−1% remain blue, but the inner turns red. This behaviour is counterintuitive to the idea that the error of a statistic test goes to zero as the sample size goes to infinity.
Original Source: Figure 2 from https://doi.org/10.1007/s11116-019-09991-9 Reworked version source code see https://gist.github.com/xor2k/2256abe4106cc8ac04a24f42bd36f2c6 |
| Date | |
| Source | Own work |
| Author | Xor2k |
Licensing
[edit]
I, the copyright holder of this work, hereby publish it under the following license:
This file is licensed under the Creative Commons Attribution-Share Alike 4.0 International license.
- You are free:
- to share – to copy, distribute and transmit the work
- to remix – to adapt the work
- Under the following conditions:
- attribution – You must give appropriate credit, provide a link to the license, and indicate if changes were made. You may do so in any reasonable manner, but not in any way that suggests the licensor endorses you or your use.
- share alike – If you remix, transform, or build upon the material, you must distribute your contributions under the same or compatible license as the original.

|
This media file is uncategorized.
Please help improve this media file by adding it to one or more categories, so it may be associated with related media files (how?), and so that it can be more easily found.
Please notify the uploader with {{subst:Please link images|File:T-test vs equivalence test.png}} ~~~~ |
File history
Click on a date/time to view the file as it appeared at that time.
| Date/Time | Thumbnail | Dimensions | User | Comment | |
|---|---|---|---|---|---|
| current | 13:06, 30 October 2021 | | 2,889 × 1,621 (589 KB) | Xor2k (talk | contribs) | stricter adhere to original diagram, using α_{t-test} instead of α_t etc. |
| 12:41, 30 October 2021 |  | 2,809 × 1,621 (577 KB) | Xor2k (talk | contribs) | minor optimization of the x axis labels | |
| 11:53, 30 October 2021 |  | 2,809 × 1,575 (573 KB) | Xor2k (talk | contribs) | adjusted colors | |
| 11:37, 30 October 2021 |  | 2,809 × 1,575 (613 KB) | Xor2k (talk | contribs) | Added a normal distribution based simulation otherwise complete rework | |
| 20:30, 22 June 2019 |  | 1,754 × 1,240 (182 KB) | Xor2k (talk | contribs) | Renamed ν to σ for better consistence with general notation. | |
| 11:01, 30 May 2019 |  | 1,373 × 903 (161 KB) | Xor2k (talk | contribs) | User created page with UploadWizard |
You cannot overwrite this file.
File usage on Commons
There are no pages that use this file.
File usage on other wikis
The following other wikis use this file:
- Usage on de.wikipedia.org
- Usage on en.wikipedia.org
- Usage on pt.wikipedia.org
- Usage on ru.wikipedia.org