File:Suomen tammikuun keskilampotila 1.png

Original file (903 × 1,188 pixels, file size: 893 KB, MIME type: image/png)
Captions
Captions
Summary
[edit]
| Description |
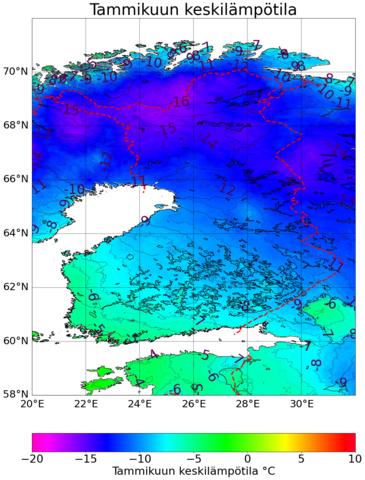
Suomi: Suomen tammikuun keskilampotila |
| Date | |
| Source | Own work |
| Author | Merikanto |
Source of data is WoldClim Historical climate data 2.1
https://www.worldclim.org/data/worldclim21.html
"This is WorldClim version 2.1 climate data for 1970-2000. This version was released in January 2020. "
Fick, S.E. and R.J. Hijmans, 2017. WorldClim 2: new 1km spatial resolution climate surfaces for global land areas. International Journal of Climatology 37 (12): 4302-4315.
Code to cut raster
library(raster)
library(viridis)
inname1<-"./data1/wc2.1_30s_tavg_01.tif"
outname1="out1.nc"
plotname1="out.png"
- ext1 <- extent(-15,40,30 , 70)
x1=20
x2=32
y1=58
y2=72
pallength1=100
ext1 <- extent(x1,x2,y1,y2)
inras1<-raster(inname1)
inshape1 <- getData("GADM", country="FI", level=0)
selras1<-crop(inras1,ext1)
png(plotname1)
image(selras1, col=rev(viridis(pallength1) ) ,
xlim=c(x1,x2), ylim=c(y1,y2)
)


contour(selras1,add=TRUE)
plot(inshape1, add=TRUE)
dev.off()
crs(selras1) <- "+proj=longlat +datum=WGS84 +no_defs +ellps=WGS84 +towgs84=0,0,0"
writeRaster(selras1, filename=outname1, varname="z", format="CDF", overwrite=TRUE)
Code to draw pic
- plot netcdf mapped data with python
- 1.11.2021 0000.0000
- input must be cut netcdf area grid in many times!
-
- latitude, longitude, z
-
-
- -*- coding: utf-8 -*-
from   mpl_toolkits.basemap import Basemap, cm
import matplotlib.pyplot as plt
from   netCDF4 import Dataset as open_ncfile
import numpy as np
from matplotlib.colors import ListedColormap, LinearSegmentedColormap
from matplotlib.pyplot import figure
plottitle="Tammikuun keskilämpötila"
- legtitle="T July avg.°C (LGM, CCSM4)"
legtitle="Tammikuun keskilämpötila °C"
- output
outsvg="out_python.svg"
outpng="out_python.png"
- contours and colormap min, max, step
zeta=-20 ## z min
zetb=10 ## z max
deltazd=1 ## z step, annotated contours
- a
deltazc=0.5 # z step, non-annotated contours
- lona=-15
- lonb=40
- lata=30
- latb=70
lona=20
lonb=32
lata=58
latb=72
- lon, lat lines in map
latdx=2
londy=2
- reso, figsize
dpi1 = 70
figux=1000
figuy=1600
figure(figsize=(10, 16), dpi=dpi1)
- palette
- cmap
- kolormap='jet'
- kolormap='jet'
- kolormap='Spectral_r'
kolormap='gist_rainbow_r'
- kolormap='BrBG'
- kolormap='rainbow'
- kolormap='viridis'
- kolormap = ListedColormap(parula_data2)
- netcdf infile name, variable names
- lon, lat, z vars
infilename='out1.nc'
zvarlabel='z'
latvarlabel='latitude'
lonvarlabel='longitude'
- load netcdf file
nc = open_ncfile(infilename)
var = nc.variables[zvarlabel][:,:]
var2=np.flipud(var)
lat = nc.variables[latvarlabel][:]
lon = nc.variables[lonvarlabel][:]
- plot
fig = plt.figure(figsize=(figux/dpi1, figuy/dpi1), dpi=dpi1)
ax  = fig.add_axes([0.1,0.1,0.8,0.9])
map = Basemap(projection='cyl',llcrnrlat=lata,urcrnrlat= latb,\
resolution='h', llcrnrlon=lona,urcrnrlon=lonb)
map.drawcoastlines(color='black')
map.drawrivers(color='black')
map.drawcountries(linewidth=3.0, linestyle='dashed', color='red')
- map.drawstates()
kolorado=( (0.0, 0.0, 0.5),(0.0, 0.0, 0.5),(0.0, 0.0, 0.5),(0.0, 0.0, 0.5), (0.0, 0.0, 0.5),(0.0, 0.0, 0.5),(0.0, 0.0, 0.5),(0.0, 0.0, 0.5))
map.drawparallels(np.arange(lata, latb,latdx),labels=[1,0,0,0],fontsize=26)
map.drawmeridians(np.arange(lona,lonb,londy),labels=[0,0,0,1],fontsize=26)
x, y = map(*np.meshgrid(lon,lat))
clevs = np.arange(zeta,zetb,deltazc)
dlevs = np.arange(zeta,zetb,deltazd)
maplot1=map.imshow(var2, cmap=kolormap, vmin=zeta, vmax=zetb)
plt.rc('lines', linewidth=0.5, color='#000000')
cnplot2 = map.contour(x,y,var,clevs,colors='#4f004f', alpha=0.2)
cnplot = map.contour(x,y,var,dlevs,colors='#4f004f')
cbar = map.colorbar(maplot1,location='bottom',pad="10%", label=legtitle)
cbar.set_label(legtitle, fontsize=28)
cbar.ax.tick_params(labelsize=28)
plt.clabel(cnplot, fmt='%.0f',fontsize=34, inline=1)
plt.title(plottitle, fontsize=40)
- plt.show()
- plt.savefig(outsvg, bbox_inches='tight', dpi=dpi1)
plt.savefig(outpng, bbox_inches='tight', dpi=dpi1)
parula_data = [[0.2422, 0.1504, 0.6603],
[0.2444, 0.1534, 0.6728],
[0.2464, 0.1569, 0.6847],
[0.2484, 0.1607, 0.6961],
[0.2503, 0.1648, 0.7071],
[0.2522, 0.1689, 0.7179],
[0.254, 0.1732, 0.7286],
[0.2558, 0.1773, 0.7393],
[0.2576, 0.1814, 0.7501],
[0.2594, 0.1854, 0.761],
[0.2611, 0.1893, 0.7719],
[0.2628, 0.1932, 0.7828],
[0.2645, 0.1972, 0.7937],
[0.2661, 0.2011, 0.8043],
[0.2676, 0.2052, 0.8148],
[0.2691, 0.2094, 0.8249],
[0.2704, 0.2138, 0.8346],
[0.2717, 0.2184, 0.8439],
[0.2729, 0.2231, 0.8528],
[0.274, 0.228, 0.8612],
[0.2749, 0.233, 0.8692],
[0.2758, 0.2382, 0.8767],
[0.2766, 0.2435, 0.884],
[0.2774, 0.2489, 0.8908],
[0.2781, 0.2543, 0.8973],
[0.2788, 0.2598, 0.9035],
[0.2794, 0.2653, 0.9094],
[0.2798, 0.2708, 0.915],
[0.2802, 0.2764, 0.9204],
[0.2806, 0.2819, 0.9255],
[0.2809, 0.2875, 0.9305],
[0.2811, 0.293, 0.9352],
[0.2813, 0.2985, 0.9397],
[0.2814, 0.304, 0.9441],
[0.2814, 0.3095, 0.9483],
[0.2813, 0.315, 0.9524],
[0.2811, 0.3204, 0.9563],
[0.2809, 0.3259, 0.96],
[0.2807, 0.3313, 0.9636],
[0.2803, 0.3367, 0.967],
[0.2798, 0.3421, 0.9702],
[0.2791, 0.3475, 0.9733],
[0.2784, 0.3529, 0.9763],
[0.2776, 0.3583, 0.9791],
[0.2766, 0.3638, 0.9817],
[0.2754, 0.3693, 0.984],
[0.2741, 0.3748, 0.9862],
[0.2726, 0.3804, 0.9881],
[0.271, 0.386, 0.9898],
[0.2691, 0.3916, 0.9912],
[0.267, 0.3973, 0.9924],
[0.2647, 0.403, 0.9935],
[0.2621, 0.4088, 0.9946],
[0.2591, 0.4145, 0.9955],
[0.2556, 0.4203, 0.9965],
[0.2517, 0.4261, 0.9974],
[0.2473, 0.4319, 0.9983],
[0.2424, 0.4378, 0.9991],
[0.2369, 0.4437, 0.9996],
[0.2311, 0.4497, 0.9995],
[0.225, 0.4559, 0.9985],
[0.2189, 0.462, 0.9968],
[0.2128, 0.4682, 0.9948],
[0.2066, 0.4743, 0.9926],
[0.2006, 0.4803, 0.9906],
[0.195, 0.4861, 0.9887],
[0.1903, 0.4919, 0.9867],
[0.1869, 0.4975, 0.9844],
[0.1847, 0.503, 0.9819],
[0.1831, 0.5084, 0.9793],
[0.1818, 0.5138, 0.9766],
[0.1806, 0.5191, 0.9738],
[0.1795, 0.5244, 0.9709],
[0.1785, 0.5296, 0.9677],
[0.1778, 0.5349, 0.9641],
[0.1773, 0.5401, 0.9602],
[0.1768, 0.5452, 0.956],
[0.1764, 0.5504, 0.9516],
[0.1755, 0.5554, 0.9473],
[0.174, 0.5605, 0.9432],
[0.1716, 0.5655, 0.9393],
[0.1686, 0.5705, 0.9357],
[0.1649, 0.5755, 0.9323],
[0.161, 0.5805, 0.9289],
[0.1573, 0.5854, 0.9254],
[0.154, 0.5902, 0.9218],
[0.1513, 0.595, 0.9182],
[0.1492, 0.5997, 0.9147],
[0.1475, 0.6043, 0.9113],
[0.1461, 0.6089, 0.908],
[0.1446, 0.6135, 0.905],
[0.1429, 0.618, 0.9022],
[0.1408, 0.6226, 0.8998],
[0.1383, 0.6272, 0.8975],
[0.1354, 0.6317, 0.8953],
[0.1321, 0.6363, 0.8932],
[0.1288, 0.6408, 0.891],
[0.1253, 0.6453, 0.8887],
[0.1219, 0.6497, 0.8862],
[0.1185, 0.6541, 0.8834],
[0.1152, 0.6584, 0.8804],
[0.1119, 0.6627, 0.877],
[0.1085, 0.6669, 0.8734],
[0.1048, 0.671, 0.8695],
[0.1009, 0.675, 0.8653],
[0.0964, 0.6789, 0.8609],
[0.0914, 0.6828, 0.8562],
[0.0855, 0.6865, 0.8513],
[0.0789, 0.6902, 0.8462],
[0.0713, 0.6938, 0.8409],
[0.0628, 0.6972, 0.8355],
[0.0535, 0.7006, 0.8299],
[0.0433, 0.7039, 0.8242],
[0.0328, 0.7071, 0.8183],
[0.0234, 0.7103, 0.8124],
[0.0155, 0.7133, 0.8064],
[0.0091, 0.7163, 0.8003],
[0.0046, 0.7192, 0.7941],
[0.0019, 0.722, 0.7878],
[0.0009, 0.7248, 0.7815],
[0.0018, 0.7275, 0.7752],
[0.0046, 0.7301, 0.7688],
[0.0094, 0.7327, 0.7623],
[0.0162, 0.7352, 0.7558],
[0.0253, 0.7376, 0.7492],
[0.0369, 0.74, 0.7426],
[0.0504, 0.7423, 0.7359],
[0.0638, 0.7446, 0.7292],
[0.077, 0.7468, 0.7224],
[0.0899, 0.7489, 0.7156],
[0.1023, 0.751, 0.7088],
[0.1141, 0.7531, 0.7019],
[0.1252, 0.7552, 0.695],
[0.1354, 0.7572, 0.6881],
[0.1448, 0.7593, 0.6812],
[0.1532, 0.7614, 0.6741],
[0.1609, 0.7635, 0.6671],
[0.1678, 0.7656, 0.6599],
[0.1741, 0.7678, 0.6527],
[0.1799, 0.7699, 0.6454],
[0.1853, 0.7721, 0.6379],
[0.1905, 0.7743, 0.6303],
[0.1954, 0.7765, 0.6225],
[0.2003, 0.7787, 0.6146],
[0.2061, 0.7808, 0.6065],
[0.2118, 0.7828, 0.5983],
[0.2178, 0.7849, 0.5899],
[0.2244, 0.7869, 0.5813],
[0.2318, 0.7887, 0.5725],
[0.2401, 0.7905, 0.5636],
[0.2491, 0.7922, 0.5546],
[0.2589, 0.7937, 0.5454],
[0.2695, 0.7951, 0.536],
[0.2809, 0.7964, 0.5266],
[0.2929, 0.7975, 0.517],
[0.3052, 0.7985, 0.5074],
[0.3176, 0.7994, 0.4975],
[0.3301, 0.8002, 0.4876],
[0.3424, 0.8009, 0.4774],
[0.3548, 0.8016, 0.4669],
[0.3671, 0.8021, 0.4563],
[0.3795, 0.8026, 0.4454],
[0.3921, 0.8029, 0.4344],
[0.405, 0.8031, 0.4233],
[0.4184, 0.803, 0.4122],
[0.4322, 0.8028, 0.4013],
[0.4463, 0.8024, 0.3904],
[0.4608, 0.8018, 0.3797],
[0.4753, 0.8011, 0.3691],
[0.4899, 0.8002, 0.3586],
[0.5044, 0.7993, 0.348],
[0.5187, 0.7982, 0.3374],
[0.5329, 0.797, 0.3267],
[0.547, 0.7957, 0.3159],
[0.5609, 0.7943, 0.305],
[0.5748, 0.7929, 0.2941],
[0.5886, 0.7913, 0.2833],
[0.6024, 0.7896, 0.2726],
[0.6161, 0.7878, 0.2622],
[0.6297, 0.7859, 0.2521],
[0.6433, 0.7839, 0.2423],
[0.6567, 0.7818, 0.2329],
[0.6701, 0.7796, 0.2239],
[0.6833, 0.7773, 0.2155],
[0.6963, 0.775, 0.2075],
[0.7091, 0.7727, 0.1998],
[0.7218, 0.7703, 0.1924],
[0.7344, 0.7679, 0.1852],
[0.7468, 0.7654, 0.1782],
[0.759, 0.7629, 0.1717],
[0.771, 0.7604, 0.1658],
[0.7829, 0.7579, 0.1608],
[0.7945, 0.7554, 0.157],
[0.806, 0.7529, 0.1546],
[0.8172, 0.7505, 0.1535],
[0.8281, 0.7481, 0.1536],
[0.8389, 0.7457, 0.1546],
[0.8495, 0.7435, 0.1564],
[0.86, 0.7413, 0.1587],
[0.8703, 0.7392, 0.1615],
[0.8804, 0.7372, 0.165],
[0.8903, 0.7353, 0.1695],
[0.9, 0.7336, 0.1749],
[0.9093, 0.7321, 0.1815],
[0.9184, 0.7308, 0.189],
[0.9272, 0.7298, 0.1973],
[0.9357, 0.729, 0.2061],
[0.944, 0.7285, 0.2151],
[0.9523, 0.7284, 0.2237],
[0.9606, 0.7285, 0.2312],
[0.9689, 0.7292, 0.2373],
[0.977, 0.7304, 0.2418],
[0.9842, 0.733, 0.2446],
[0.99, 0.7365, 0.2429],
[0.9946, 0.7407, 0.2394],
[0.9966, 0.7458, 0.2351],
[0.9971, 0.7513, 0.2309],
[0.9972, 0.7569, 0.2267],
[0.9971, 0.7626, 0.2224],
[0.9969, 0.7683, 0.2181],
[0.9966, 0.774, 0.2138],
[0.9962, 0.7798, 0.2095],
[0.9957, 0.7856, 0.2053],
[0.9949, 0.7915, 0.2012],
[0.9938, 0.7974, 0.1974],
[0.9923, 0.8034, 0.1939],
[0.9906, 0.8095, 0.1906],
[0.9885, 0.8156, 0.1875],
[0.9861, 0.8218, 0.1846],
[0.9835, 0.828, 0.1817],
[0.9807, 0.8342, 0.1787],
[0.9778, 0.8404, 0.1757],
[0.9748, 0.8467, 0.1726],
[0.972, 0.8529, 0.1695],
[0.9694, 0.8591, 0.1665],
[0.9671, 0.8654, 0.1636],
[0.9651, 0.8716, 0.1608],
[0.9634, 0.8778, 0.1582],
[0.9619, 0.884, 0.1557],
[0.9608, 0.8902, 0.1532],
[0.9601, 0.8963, 0.1507],
[0.9596, 0.9023, 0.148],
[0.9595, 0.9084, 0.145],
[0.9597, 0.9143, 0.1418],
[0.9601, 0.9203, 0.1382],
[0.9608, 0.9262, 0.1344],
[0.9618, 0.932, 0.1304],
[0.9629, 0.9379, 0.1261],
[0.9642, 0.9437, 0.1216],
[0.9657, 0.9494, 0.1168],
[0.9674, 0.9552, 0.1116],
[0.9692, 0.9609, 0.1061],
[0.9711, 0.9667, 0.1001],
[0.973, 0.9724, 0.0938],
[0.9749, 0.9782, 0.0872],
[0.9769, 0.9839, 0.0805]]
parula_data2=parula_data[::-1]
Licensing
[edit]
- You are free:
- to share – to copy, distribute and transmit the work
- to remix – to adapt the work
- Under the following conditions:
- attribution – You must give appropriate credit, provide a link to the license, and indicate if changes were made. You may do so in any reasonable manner, but not in any way that suggests the licensor endorses you or your use.
- share alike – If you remix, transform, or build upon the material, you must distribute your contributions under the same or compatible license as the original.
File history
Click on a date/time to view the file as it appeared at that time.
| Date/Time | Thumbnail | Dimensions | User | Comment | |
|---|---|---|---|---|---|
| current | 15:28, 1 November 2021 | | 903 × 1,188 (893 KB) | Merikanto (talk | contribs) | Uploaded own work with UploadWizard |
You cannot overwrite this file.
File usage on Commons
There are no pages that use this file.