File:South Africa 2011 dominant population group map.svg
Jump to navigation
Jump to search

Size of this PNG preview of this SVG file: 684 × 599 pixels. Other resolutions: 274 × 240 pixels | 548 × 480 pixels | 876 × 768 pixels | 1,168 × 1,024 pixels | 2,337 × 2,048 pixels | 809 × 709 pixels.
Original file (SVG file, nominally 809 × 709 pixels, file size: 787 KB)
Captions
Captions
Add a one-line explanation of what this file represents
Summary
[edit]
| Description |
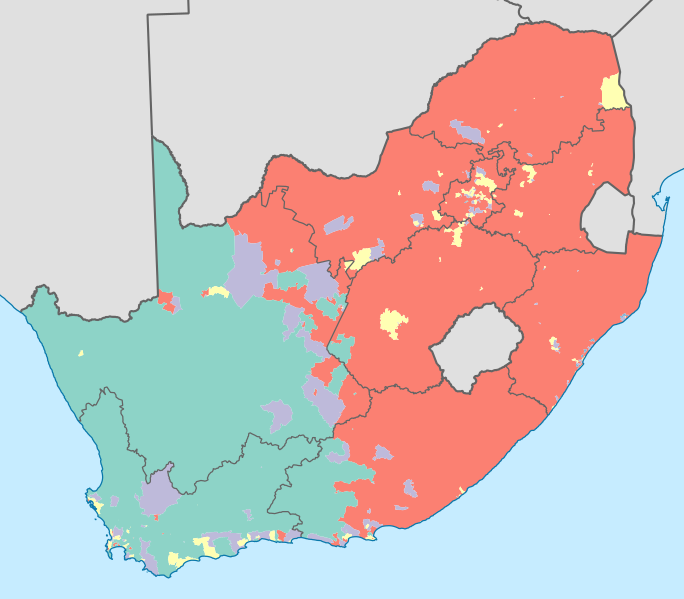
English: Map showing the dominant population groups in South Africa, according to Census 2011, at electoral ward level. A population group is considered dominant if it makes up more than 50% of the population in a ward, or if it makes up more than 33% and no other group makes up more than 25%.
Black African
Coloured
Indian or Asian
White
No group dominant
Projection is Albers Equal-Area Conic, with standard parallels at 25.5° S and 31.5° S, and origin at 28.5° S 25.5° E. |
| Date | |
| Source | Statistics South Africa's Census 2011 is the source of the basic population data. The map results from my own processing of the data. The map results from my own processing of the data. For ward boundaries see File:South Africa electoral wards 2011 blank.svg. |
| Author | Htonl |
| Other versions |
South Africa 2011 dominant population group map (hex cells).svg: .svg) |
Licensing
[edit]
The following license applies to the population data on which the map is based:

|
The copyright holder of this file, Stats SA, allows anyone to use it for any purpose, provided that the copyright holder is properly attributed. Redistribution, derivative work, commercial use, and all other use is permitted. |
Attribution:
"the user acknowledges Stats SA as the source of the basic data wherever they process, apply, utilise, publish or distribute the data, and also that they specify that the relevant application and analysis (where applicable) result from their own processing of the data" [1]
|
The following tag applies to the map itself:
| I, the copyright holder of this work, release this work into the public domain. This applies worldwide. In some countries this may not be legally possible; if so: I grant anyone the right to use this work for any purpose, without any conditions, unless such conditions are required by law. |
File history
Click on a date/time to view the file as it appeared at that time.
| Date/Time | Thumbnail | Dimensions | User | Comment | |
|---|---|---|---|---|---|
| current | 00:13, 17 April 2013 | | 809 × 709 (787 KB) | Htonl (talk | contribs) | =={{int:filedesc}}== {{Information |Description={{en|1=Map showing the dominant population groups in South Africa, according to Census 2011, at electoral ward level. A population group is considered dominant if it makes up more than 50% of the populati... |
You cannot overwrite this file.
File usage on Commons
The following 2 pages use this file:
File usage on other wikis
The following other wikis use this file:
- Usage on af.wikipedia.org
- Usage on cs.wikipedia.org
- Usage on es.wikipedia.org
- Usage on fr.wikipedia.org
- Usage on ha.wikipedia.org
- Usage on he.wikipedia.org
- Usage on it.wikipedia.org
- Usage on ka.wikipedia.org
- Usage on pt.wikipedia.org
- Usage on ro.wikipedia.org
- Usage on ru.wikipedia.org
- Usage on sr.wikipedia.org
- Usage on tg.wikipedia.org
- Usage on uk.wikipedia.org
- Usage on zh.wikipedia.org