File:Slater-Determinant.png
Jump to navigation
Jump to search
No higher resolution available.
Slater-Determinant.png (572 × 438 pixels, file size: 57 KB, MIME type: image/png)
Captions
Captions
Add a one-line explanation of what this file represents
Summary
[edit]
| Description |
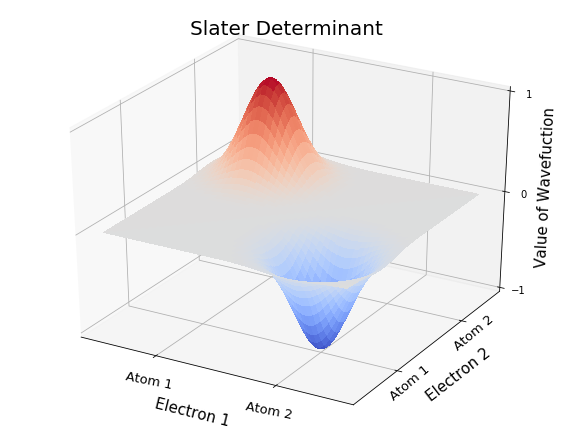
English: 3-D Plot of a Slater-Determinant wavefunction for two electrons moving in one dimension
Deutsch: 3-D Plot einer Wellenfunction als Slater-Determinante für zwei Elektronen, die sich in einer Dimension bewegen |
| Date | |
| Source | Own work |
| Author | Lpd-Lbr |
Generated with
Python 3.7.1
matplotlib 3.0.2
from mpl_toolkits.mplot3d import Axes3D
import matplotlib.pyplot as plt
from matplotlib import cm
from matplotlib.ticker import LinearLocator, FormatStrFormatter
import numpy as np

def gaussian(x, alpha):
    return math.exp(-alpha*x*x/2)

gridpoints = np.arange(0, 100, 1)
posr1 = 25
alpha1 = 0.01
posr2 = 75
alpha2 = 0.01
gamma = 1
HP1 = [[gaussian(r1 - posr1, alpha1)*gaussian(r2 - posr2, alpha2) for r1 in gridpoints] for r2 in gridpoints]
HP2 = [[gaussian(r2 - posr1, alpha1)*gaussian(r1 - posr2, alpha2) for r1 in gridpoints] for r2 in gridpoints]
SD1 = np.array(HP1) - np.array(HP2)
SD2 = np.array(HP2) - np.array(HP1)

X = gridpoints
Y = gridpoints
X, Y = np.meshgrid(X, Y)

fig = plt.figure(figsize=(10,7.8))
ax = fig.gca(projection='3d')

surf = ax.plot_surface(X, Y, SD1, cmap=cm.coolwarm,
                       linewidth=0, antialiased=False)

ax.set_title("Slater Determinant", fontsize = 20)
ax.set_xlabel("Electron 1", fontsize = 15)
ax.set_xticks([25, 75])
ax.set_xticklabels(["Atom 1", "Atom 2"], fontsize = 13, rotation  = -11)
ax.set_ylabel("Electron 2", fontsize = 15)
ax.set_yticks([25, 75])
ax.set_yticklabels(["Atom 1", "Atom 2"], fontsize = 13, rotation = 40, verticalalignment = "center")
ax.set_zlabel("Value of Wavefuction", fontsize = 15)
ax.set_zticks([-1, 0, 1])
ax.xaxis.labelpad = 13
ax.yaxis.labelpad = 7

plt.show()
Licensing
[edit]
I, the copyright holder of this work, hereby publish it under the following licenses:

|
Permission is granted to copy, distribute and/or modify this document under the terms of the GNU Free Documentation License, Version 1.2 or any later version published by the Free Software Foundation; with no Invariant Sections, no Front-Cover Texts, and no Back-Cover Texts. A copy of the license is included in the section entitled GNU Free Documentation License. |
This file is licensed under the Creative Commons Attribution 3.0 Unported license.
- You are free:
- to share – to copy, distribute and transmit the work
- to remix – to adapt the work
- Under the following conditions:
- attribution – You must give appropriate credit, provide a link to the license, and indicate if changes were made. You may do so in any reasonable manner, but not in any way that suggests the licensor endorses you or your use.
You may select the license of your choice.
File history
Click on a date/time to view the file as it appeared at that time.
| Date/Time | Thumbnail | Dimensions | User | Comment | |
|---|---|---|---|---|---|
| current | 14:41, 29 October 2019 | | 572 × 438 (57 KB) | Lpd-Lbr (talk | contribs) | {{Information |description ={{en|1=3-D Plot of a Slater-Determinant wavefunction for two electrons moving in one dimension}} {{de|1=3-D Plot einer Wellenfunction als Slater-Determinante für zwei Elektronen, die sich in einer Dimension bewegen}} |date =2019-10-29 |source ={{own}} |author =User:Lpd-Lbr }} Generated with<br /> Python 3.7.1<br /> matplotlib 3.0.2<br /> <nowiki>from mpl_toolkits.mplot3d import Axes3D import matplotlib.pyplot as plt from matplotlib i... |
You cannot overwrite this file.
File usage on Commons
There are no pages that use this file.
File usage on other wikis
The following other wikis use this file:
- Usage on de.wikipedia.org