File:Singular spectrum analysis grouped reconstruction.svg

Original file (SVG file, nominally 485 × 346 pixels, file size: 58 KB)
Captions
Captions
Summary
[edit]
| Description |
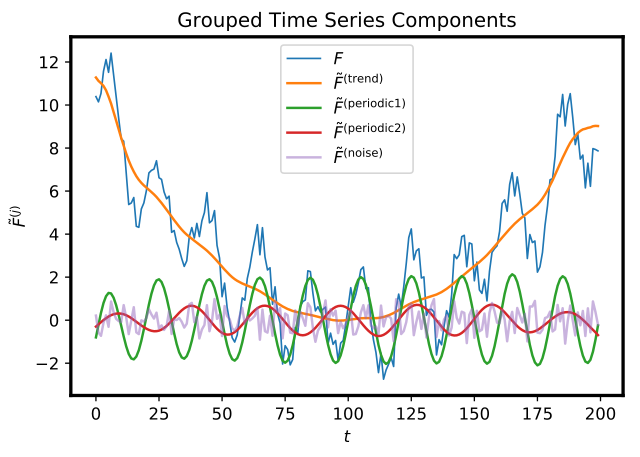
English: Singular spectrum analysis applied to a time-series F, with reconstructed components grouped into trend, oscillations, and noise. |
| Date | |
| Source | https://www.kaggle.com/jdarcy/introducing-ssa-for-time-series-decomposition |
| Author | Jordan D'Arcy |
Licensing
[edit]
| Copyright © Jordan D'Arcy
Licensed under the Apache License, Version 2.0 (the "License"); you may not use this file except in compliance with the License. You may obtain a copy of the License at https://www.apache.org/licenses/LICENSE-2.0. Unless required by applicable law or agreed to in writing, software distributed under the License is distributed on an "AS IS" BASIS, WITHOUT WARRANTIES OR CONDITIONS OF ANY KIND, either express or implied. See the License for the specific language governing permissions and limitations under the License. |
File history
Click on a date/time to view the file as it appeared at that time.
| Date/Time | Thumbnail | Dimensions | User | Comment | |
|---|---|---|---|---|---|
| current | 17:55, 29 November 2019 | | 485 × 346 (58 KB) | InverseHypercube (talk | contribs) | User created page with UploadWizard |
You cannot overwrite this file.
File usage on Commons
There are no pages that use this file.
File usage on other wikis
The following other wikis use this file:
- Usage on en.wikipedia.org
- Usage on uk.wikipedia.org