File:Saudi Arabian Grand Prix-2021.png
Original file (1,920 × 1,440 pixels, file size: 152 KB, MIME type: image/png)
Captions
Captions
Summary
[edit]
| Description |
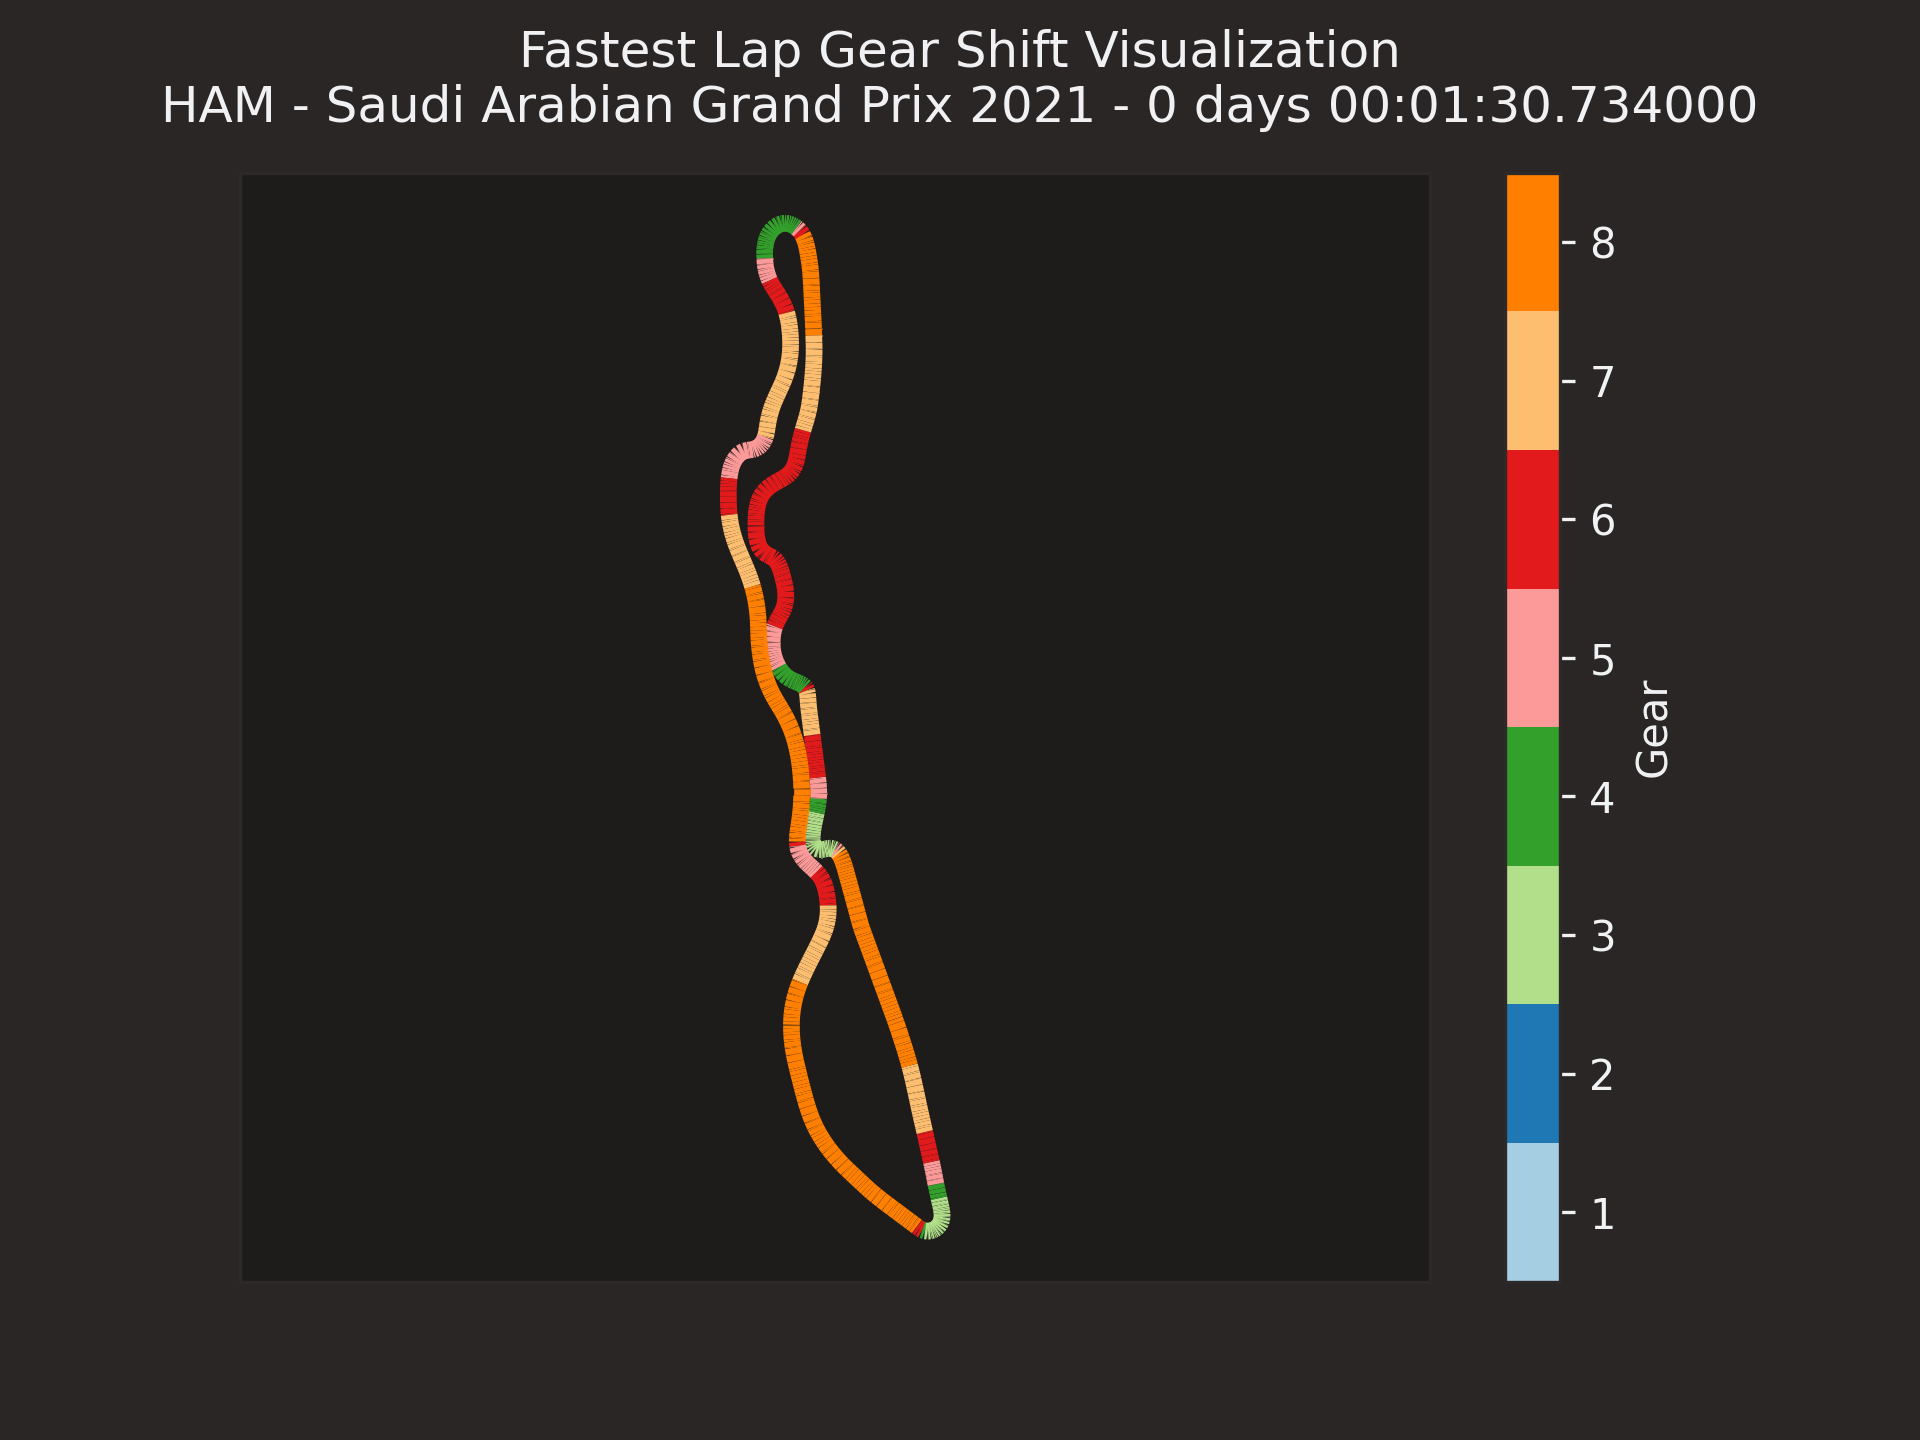
English: Hamilton's gear position in the Saudi Arabian Grand Prix |
| Date | |
| Source |
Own work; In Python:
import fastf1 from fastf1 import plotting import matplotlib.pyplot as plt from matplotlib.collections import LineCollection from matplotlib import cm import numpy as np
plotting.setup_mpl()
fastf1.Cache.enable_cache('I:\Documents\F1_Cache')
session = fastf1.get_session(2019, "United States Grand Prix", "R") laps = session.load_laps(with_telemetry=True) lap = laps.pick_fastest() laptime = lap['LapTime'] tel = lap.get_telemetry()
x = np.array(tel['X'].values) y = np.array(tel['Y'].values) points = np.array([x, y]).T.reshape(-1, 1, 2) segments = np.concatenate([points[:-1], points[1:]], axis=1) gear = tel['nGear'].to_numpy().astype(float)
cmap = cm.get_cmap('Paired') lc_comp = LineCollection(segments, norm=plt.Normalize(1, cmap.N+1), cmap=cmap) lc_comp.set_array(gear) lc_comp.set_linewidth(4)
plt.gca().add_collection(lc_comp) plt.axis('equal') plt.tick_params(labelleft=False, left=False, labelbottom=False, bottom=False) title = plt.suptitle( f"Fastest Lap Gear Shift Visualization\n"
f"{lap['Driver']} - {session.weekend.name} {session.weekend.year} - {laptime}"
)
cbar = plt.colorbar(mappable=lc_comp, label="Gear", boundaries=np.arange(1, 10)) cbar.set_ticks(np.arange(1.5, 9.5)) cbar.set_ticklabels(np.arange(1, 9)) plt.savefig(f"img\FastestLapGear\{session.weekend.name}-{session.weekend.year}-Gear.png", dpi=300) plt.show() |
| Author | Kilawyn Punx |
Licensing
[edit]
- You are free:
- to share – to copy, distribute and transmit the work
- to remix – to adapt the work
- Under the following conditions:
- attribution – You must give appropriate credit, provide a link to the license, and indicate if changes were made. You may do so in any reasonable manner, but not in any way that suggests the licensor endorses you or your use.
- share alike – If you remix, transform, or build upon the material, you must distribute your contributions under the same or compatible license as the original.
File history
Click on a date/time to view the file as it appeared at that time.
| Date/Time | Thumbnail | Dimensions | User | Comment | |
|---|---|---|---|---|---|
| current | 17:40, 19 December 2021 | | 1,920 × 1,440 (152 KB) | Kilawyn Punx (talk | contribs) | Cross-wiki upload from en.wikipedia.org |
You cannot overwrite this file.
File usage on Commons
There are no pages that use this file.