File:Reddish tlp sites on the moon 1.png

Original file (845 × 817 pixels, file size: 468 KB, MIME type: image/png)
Captions
Captions
Summary
[edit]
| Description |
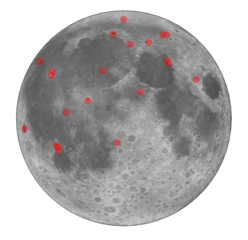
English: Reddish TLP sites on the Moon. |
| Date | |
| Source | Own work |
| Author | Merikanto |
Source of TLP data for this TLP map of moon is

English: *Description: This map displays an approximate distribution of transient lunar phenomena. It is based on a monochrome map by Barbara Middlehurst and Patrick Moore that was published in the book, On the Moon, 2001, Cassel & Co., ISBN 0304354694. Red dots indicate TLP that appeared to the observer as a reddish cloud. Yellow dots are all other events.
   Size: 281 × 284 pixels.
   Source:' This is a modified version of a photo obtained from the NASA Planetary Photojournal. It was modified by RJHall.
Map data for this map comes from
# NASA "CGI Moon Kit"
# https://svs.gsfc.nasa.gov/cgi-bin/details.cgi?aid=4720
Image map: lroc_color_poles_8k.tif
Displacement: ./indata/ldem_16.tif
Python3 source code to draw map is
- 3
- TLP sites on the Moon
-
- Python3 basemap, imageio
- 17.06.2024 0000.0003a2
- TLP data from
-
- ChatGPT
- Moon imagemap and dem from:
-
-
import matplotlib.pyplot as plt
import cartopy.crs as ccrs
import imageio
import numpy as np
- from mpl_toolkits.basemap import shiftgrid
from matplotlib.colors import LightSource
def acquire_image_rgb(iname1):
	img0 = imageio.imread(iname1)
	shp0=np.shape(img0)
	print(shp0)
	width=shp0[1]
	height=shp0[0]
	print(width, height)
	lats = np.linspace(-np.pi / 2, np.pi / 2, height)
	lons = np.linspace(0, 2 * np.pi, width)
	img1=img0[:,:,0]
	#plt.imshow(img1)
	#plt.show()
	#quit(-1)
	return(img1, lons, lats)


def acquire_image_gray(iname1):
	img0 = imageio.imread(iname1)
	shp0=np.shape(img0)
	print(shp0)
	width=shp0[1]
	height=shp0[0]
	print(width, height)
	lats = np.linspace(-np.pi / 2, np.pi / 2, height)
	lons = np.linspace(0, 2 * np.pi, width)
	img1=img0
	#plt.imshow(img1)
	#plt.show()
	#quit(-1)
	return(img1, lons, lats)
def sample_data(shape=(4000, 2000)):
   """Returns ``lons``, ``lats`` and ``data`` of some fake data."""
   nlats, nlons = shape
   lats = np.linspace(-np.pi / 2, np.pi / 2, nlats)
   lons = np.linspace(0, 2 * np.pi, nlons)
   lons, lats = np.meshgrid(lons, lats)
   wave = 0.75 * (np.sin(2 * lats) ** 8) * np.cos(4 * lons)
   mean = 0.5 * np.cos(2 * lats) * ((np.sin(2 * lats)) ** 2 + 2)
   lats = np.rad2deg(lats)
   lons = np.rad2deg(lons)
   data = wave + mean
return lons, lats, data
- main program
imagename1="../../alunardata1/lroc_color_poles_8k.tif"
- imagename1="../../alunardata1/lroc_color_poles_2k_g.tif"
imagename2="../../alunardata1/ldem_16.tif"
- imagename1="./indata/testmap.jpg"
- imagename2="./indata/testdem.jpg"
data1, lons, lats=acquire_image_rgb(imagename1)
data2, lons, lats=acquire_image_gray(imagename2)
- data2, lons, lats=acquire_image_gray(imagename2)
ls = LightSource(azdeg=0,altdeg=65)
- shade data, creating an rgb array.
data3= ls.shade(data2,plt.cm.gray)
- ax = plt.axes(projection=ccrs.Mollweide())
- ax = plt.axes(projection=ccrs.PlateCarree())
ax = plt.axes(projection=ccrs.Orthographic())


names0=['Aristarchus', 'Plato', 'Kepler', 'Tycho', 'Alphonsus', 'Grimaldi', 'Copernicus','Gassendi', 'Eratosthenes', 'Posidonius', 'Theophilus', 'Langrenus', 'Proclus','Atlas', 'Aristoteles', 'Eudoxus', 'Hyginus N', 'Römer', 'Messier', 'Pico']
lox0= [-47.4, -9.3, -38.0, -11.2, -3.2, -68.3, -20.0, -40.0, -11.3, 29.9, 26.4, 60.9,46.8, 44.4, 17.4, 16.3, 6.3, 36.4, 47.7, -8.8]
lay0=[23.7, 51.6, 8.1, -43.3, -13.6, -5.2, 9.7, -17.5, 14.5, 31.8, -11.4, -8.9, 16.1,46.7, 50.2, 44.3, 7.8, 25.3, -2.3, 45.6]
events0=[63, 55, 37, 34, 33, 27, 23, 20, 16, 14, 14, 13, 12, 12, 11, 11, 10, 10, 9, 9]
- patrick moore reddish tlp data
lox3=[-47.55608205 ,-20.1 , -9.3 , -39.84734885 ,-68.,
-67.3    ,    -12.72 ,        4.3     ,    -0.29160565 , -3.8,
  9.    ,      18.86 ,       29.11589291  ,35.1   ,      39.1,
 45.7   ,     -32.56592573 ,-39.80200336 ,-40.61822217, -47.85082774,
 28.20647868]
lay3=[ 23.65900912 , 9.5 , 51.6 , -17.46934981 ,-5.5,
 32.  ,        26.4      ,   43.45    ,    67.04458682, -13.0,
 14.21   ,     44.9    ,     30.66851108 , 50.9    ,     50.8,
 21.2  ,        3.1977772  ,-15.42880278 ,-14.65792946  ,25.8809381,
 32.64549853]
- names only partally ok !!!
names3=["Aristachus", "Copernicus", "Plato", "Gassendi", "Grimaldi",
	"p1", "p2", "mons1", "p3", "Alphonsus", "p4", "p5"
	,"p5", "p6"]
- patrick moore: other than red tlp data
lox2=[-11.20951883 , 32.75868201 ,-12.19801255 , 51.7 , 25.68106695,
  0.21746862 , 17.8126569  , 46.3208159  , 28.96286611 , 27.7,
 17.41725941 , 23.95       , 44.5        , 54.32       , 61.97855649,
 61.6        , 61.425       ,68.73985356 , 57.98504184 , 57.86642259,
 31.23640167 , 31.45387029 , 26.3334728  , 24.51464435 , 23.40753138,
 17.06140167 , 17.28875523 , 13.81914226 , 60.71328452 , 73.28692469,
 11.09089958 , 10.89320084 ,  7.88817992 ,  4.2        , 27.5,
-55.57       , -4.35       , -1.7        , -1.99675732 , -8.5208159,
 -3.9539749  , -5.91119247 ,-13.38420502 ,-48.28       ,-66.81229079,
-74.2        ,-33.35177824 ,-29.36       ,-29.25941423 ,-20.9165272,
-25.54267782, -23.92      , -23.16040795 ,-33.39131799 ,-42.37672594,
-48.86124477 ,-27.82609833 , 41.36846234 , 26.89691423 , 49.19733264,
 40.26134937 ,  6.09900628 , -0.85998954 , -1.09722803 , -2.75789749,
 -9.        , -14.54074268,  -7.71025105,  21.98410042]
lay2=[-43.3751046 , -0.35585774 ,-61.08891213 ,-55.2 , -67.09895397,
-33.01569038 ,-33.25292887 , -3.51903766  , 1.97698745 ,-14.3,
-10.68561715 ,-13.4        , 11.9        , 12.3        , 10.99205021,
 13.45      , 12.09916318 , 15.42050209 , 23.76338912 , 22.49811715,
 17.6248431  , 21.47996862 , 17.23933054 , 15.14372385 , 12.57364017,
 16.21129707  , 2.83697699 , 18.1289749  , -6.40543933 ,-26.80794979,
  4.89304393  , 2.2834205  ,  9.08425732 ,  5.02       , 33.6,
-44.35       ,  2.91       , -9.6        , -5.53556485 ,-22.41903766,
-21.58870293 ,-16.62646444 ,-29.93158996, -20.95      ,-16.86370293,
 -2.55      , 41.44754184 , -9.22       , 15.49958159 , 25.74037657,
 27.71736402 , 33.94       , 40.46893305 , 41.4376569  , 49.9584728,
 55.25679916 , 64.35094142 , 59.4084728  , 66.84194561 , 53.39843096,
 48.96997908 , 36.98943515 , 40.46893305 , 45.96495816 , 47.50700837,
 46.        ,  48.77228033 , 15.75658996 , 16.98232218]
- names nok
names2=["Tycho", "y1", "y2", "y3", "y4", "y5", "y6", "f1","m1", "m2", "m3", "m4", "m5", "m6", "m7", "m8", "m9", "m10", "m11", "m12", "m13", "m14", "m15", "m16", "m17", "ma1", "ma2", "ma3", "fecr1", "edge1", "ka1", "ka2", "ka3", "ka4", "ka5", "sch1", "big1", "big2", "ka6", "ka7", "ka8", "ka9", "big3", "ka10", "edge2", "edge3", "ma3", "ma4", "ma5", "ma6", "ma7", "ma8", "sinus1", "big4", "edge4", "edge5", "v1", "v2", "big5", "v3", "q1", "piko1", "piko2", "piko3", "piko4", "piko5"]
- lons, lats, data = sample_data()
- ax.contourf(lons, lats, data,transform=ccrs.PlateCarree(),cmap='Spectral')
ax.imshow(data1, transform=ccrs.PlateCarree(),cmap='gray')
ax.imshow(data3, transform=ccrs.PlateCarree(),cmap='gray', alpha=0.5)


for n in range(0, len(lox3)):
	ax.scatter(lox3[n], lay3[n], transform=ccrs.PlateCarree(), color="red", alpha=0.4, s=240)
- for n in range(0, len(lox2)):
- ax.scatter(lox2[n], lay2[n], transform=ccrs.PlateCarree(), color="yellow", alpha=0.2, s=120)
- ax.scatter(lox2[n], lay2[n], transform=ccrs.PlateCarree(), color="yellow", alpha=0.4, s=40)
- ax.scatter(lox0[n], lay0[n], transform=ccrs.PlateCarree(), color="green", alpha=0.4, s=40)
- ax.scatter(lox1[n], lay1[n], transform=ccrs.PlateCarree(), color="red", alpha=0.4, s=60)
- #ax.scatter(lox[n], lay[n], transform=ccrs.PlateCarree(), color="orange", alpha=0.4, s=events[n]*3)
- ax.scatter(lox[n], lay[n], transform=ccrs.PlateCarree(), color="yellow", alpha=0.6, s=events[n]*2)
ax.set_global()
plt.show()
Licensing
[edit]
| This file is made available under the Creative Commons CC0 1.0 Universal Public Domain Dedication. | |
| The person who associated a work with this deed has dedicated the work to the public domain by waiving all of their rights to the work worldwide under copyright law, including all related and neighboring rights, to the extent allowed by law. You can copy, modify, distribute and perform the work, even for commercial purposes, all without asking permission.
|
File history
Click on a date/time to view the file as it appeared at that time.
| Date/Time | Thumbnail | Dimensions | User | Comment | |
|---|---|---|---|---|---|
| current | 10:41, 17 June 2024 | | 845 × 817 (468 KB) | Merikanto (talk | contribs) | Update of coordinates |
| 11:21, 9 June 2024 |  | 808 × 803 (468 KB) | Merikanto (talk | contribs) | Update | |
| 11:19, 9 June 2024 |  | 1,680 × 963 (532 KB) | Merikanto (talk | contribs) | Uploaded own work with UploadWizard |
You cannot overwrite this file.
File usage on Commons
There are no pages that use this file.