File:Quantum Harmonic Oscillator Levels.png
Jump to navigation
Jump to search

Size of this preview: 800 × 526 pixels. Other resolutions: 320 × 211 pixels | 640 × 421 pixels | 1,024 × 674 pixels | 1,280 × 842 pixels | 1,596 × 1,050 pixels.
Original file (1,596 × 1,050 pixels, file size: 441 KB, MIME type: image/png)
Captions
Captions
Add a one-line explanation of what this file represents
| Description |
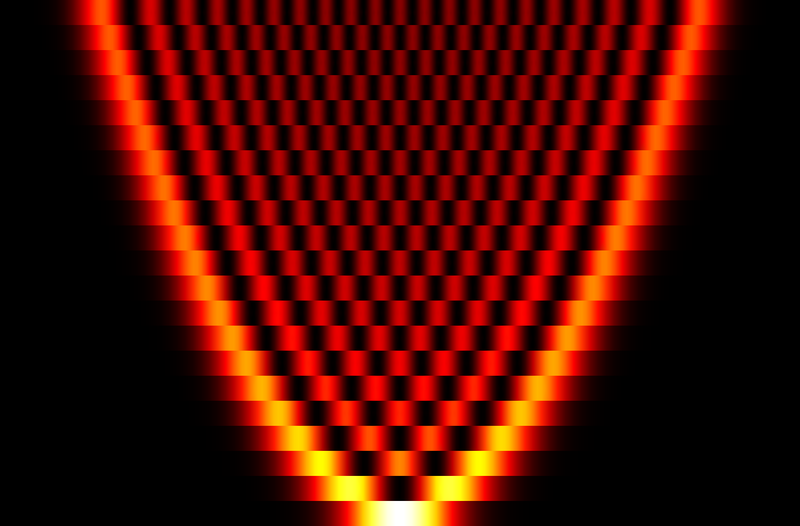
English: A diagram showing wavefunction of a quantum harmonic oscillator for energy levels n = 0 to 20. The probability density is shown by the colour, black is the lowest, white is the highest. |
||
| Date | |||
| Source | Own work | ||
| Author | Inductiveload | ||
| Permission (Reusing this file) |
|
Mathematica Code
[edit]
(*QHO wavefunction*)
psi[n_, x_] := Exp[-x^2/2] / Sqrt[2^n *n!*Sqrt[Pi]]*HermiteH[n, x];

(*Colour function*)
colourFunc[x_] := (Blend[{Black, Red, Yellow, White}, x*1.8] &);

(*Generates a single strip showing one QHO energy level wavefunction*)
level[n_] := DensityPlot[
   psi[n, x]^2,
   {x, -8, 8},
   {y, 0, 1},
   PlotRange -> {0, 0.7},
   PlotPoints -> {100, 2},
   Frame -> False,
   ColorFunction -> colourFunc[#],
   AspectRatio -> 1/32,
   ImageSize -> 1600,
   Method -> {"ShrinkWrap" -> True},(*Remove whitespace at edges*)
   ColorFunctionScaling -> False (*Have a consistent CF scaling*)
   ];

(*Assemble the entire drawing of all levels*)
graphic = GraphicsGrid[
  Reverse[Table[
    {level[k]},
    {k, 0, 20}]],
  Spacings -> 0]
File history
Click on a date/time to view the file as it appeared at that time.
| Date/Time | Thumbnail | Dimensions | User | Comment | |
|---|---|---|---|---|---|
| current | 15:49, 19 April 2009 | | 1,596 × 1,050 (441 KB) | Inductiveload (talk | contribs) | {{Information |Description={{en|1=A diagram showing wavefunction of a en:quantum harmonic oscillator for energy levels ''n'' = 0 to 20. The probability density is shown by the colour, black is the lowest, white is the highest.}} |Source=Own work by |
You cannot overwrite this file.
File usage on Commons
There are no pages that use this file.
File usage on other wikis
The following other wikis use this file:
- Usage on fi.wikipedia.org