File:Projected global primary electricity consumption by source, over the 21st century, for a climate change mitigation scenario.png

Original file (1,508 × 850 pixels, file size: 71 KB, MIME type: image/png)
Captions
Captions
Summary
[edit]
| Description |
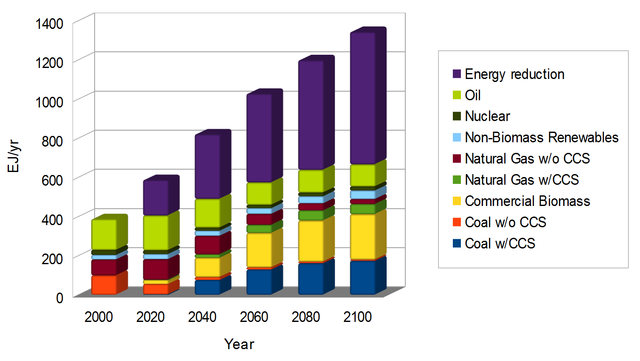
English: This graph shows a projection of global primary electricity consumption (PEC) by source, over the 21st century. It is based on a climate change mitigation scenario, in which anthropogenic (i.e., human) greenhouse gas emissions are substantially reduced over the century.
The graph shows how a variety of energy sources contribute to PEC. It also shows how energy consumption is reduced compared to a "reference scenario", in which no efforts are made to reduce greenhouse gas emissions. In the scenario, PEC increases over time, from 387 exajoules (EJ) in 2000, to 666 EJ in 2100. Energy savings contribute significantly to reductions in energy use compared to the reference scenario. In the reference scenario, PEC increases from 387 EJ in 2000 to 1344 EJ in 2100. The graph shows that fossil fuels dominate PEC in 2000. By 2060, most coal is used with carbon capture and storage (CCS), with a increase in the share of PEC supplied by commercial biomass. In 2100, the percentage contributions to PEC are: energy reductions 51; coal with CCS 13; coal without CCS 0.4; commercial biomass 17; natural gas with CCS 3.8; natural gas without CCS 1.9; non-biomass renewables 3.3; nuclear power 1.5; oil 8.4. Data Data for the mitigation scenario are summarized below. The full set of data are provided in a later section as comma-separated values (CSV). The data below summarizes PEC by source in EJ. Energy reductions in the mitigation scenario are equal to total PEC in the reference scenario minus total PEC in the mitigation scenario. Data are provided for the years 2000, 2050, and 2100, respectively:
The following data shows the percentage contribution of sources to total PEC. Data are provided for the years 2000, 2050, and 2100, respectively:
Data sources Scenario data are taken from Clarke et al. (2007)[1] The graph is based on the "IGSM_REF" reference and "IGSM_Level1" mitigation scenarios. Data from Clarke et al. (2007)[1] are in the public-domain, and are included in a following section. The report by Clarke et al. (2007)[2] includes a graph similar to this one.
References
|
| Date | |
| Source |
Own work This chart was created with LibreOffice Calc. |
| Author | Enescot |
| Other versions | Greyscale version |
.png)
Comma-separated values
[edit]
Data were exported from OpenOffice.org 4.0.0 Calc as comma separated values (csv). The following options were used:
- Character set: Western Europe 1252
- Field delimiter: ,
- Text delimiter: "
- Quote all text cells: no
- Save cell content as shown: yes
- Fixed column width: no
,2000,2020,2040,2060,2080,2100
Coal w/CCS,0,1.8726625295,75.444508718,129.1418011217,161.2538170578,173.6080558426
Coal w/o CCS,98.8551419634,52.5763595296,14.7533997718,10.6949287477,7.8754730012,5.8328272264
Commercial Biomass,0,20.6083814814,99.0391793264,176.0803406657,210.4123076545,232.6318594815
Natural Gas w/CCS,0,1.5101981599,17.1928804846,41.4536597029,51.1393522238,51.5289485318
Natural Gas w/o CCS,81.7896749777,105.2241810432,94.7490924601,55.8540853312,36.0936516819,24.8688375282
Non-Biomass Renewables,22.4833651954,25.7664179053,25.7110203361,29.253511178,36.4853378946,44.045134245
Nuclear,25.5985811645,19.5501420401,16.2462719057,16.8718264901,18.7264128277,20.4973853194
Oil,158.145950192,178.1305902789,146.8464751178,114.2820116004,115.9689587686,113.0792083141
Energy reduction,-0.000000048,181.9869034265,330.6765460279,454.2481828487,561.2932891661,677.6003453143
Licensing
[edit]
| This file is made available under the Creative Commons CC0 1.0 Universal Public Domain Dedication. | |
| The person who associated a work with this deed has dedicated the work to the public domain by waiving all of their rights to the work worldwide under copyright law, including all related and neighboring rights, to the extent allowed by law. You can copy, modify, distribute and perform the work, even for commercial purposes, all without asking permission.
|
File history
Click on a date/time to view the file as it appeared at that time.
| Date/Time | Thumbnail | Dimensions | User | Comment | |
|---|---|---|---|---|---|
| current | 08:10, 3 November 2013 | | 1,508 × 850 (71 KB) | Enescot (talk | contribs) | {{Information |Description ={{en|1=This graph shows a projection of global primary electricity consumption (PEC) by source, over the 21st century. It is based on a [[:en:climate change mitigation|climate change mitiga... |
You cannot overwrite this file.
File usage on Commons
There are no pages that use this file.
File usage on other wikis
The following other wikis use this file:
- Usage on cs.wikipedia.org
- Usage on da.wikipedia.org