File:Polar amplification.png

Original file (3,182 × 2,044 pixels, file size: 806 KB, MIME type: image/png)
Captions
Captions
Summary
[edit]
| Description |
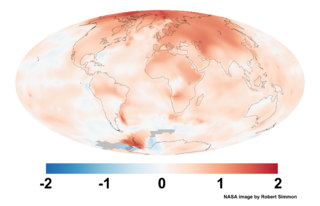
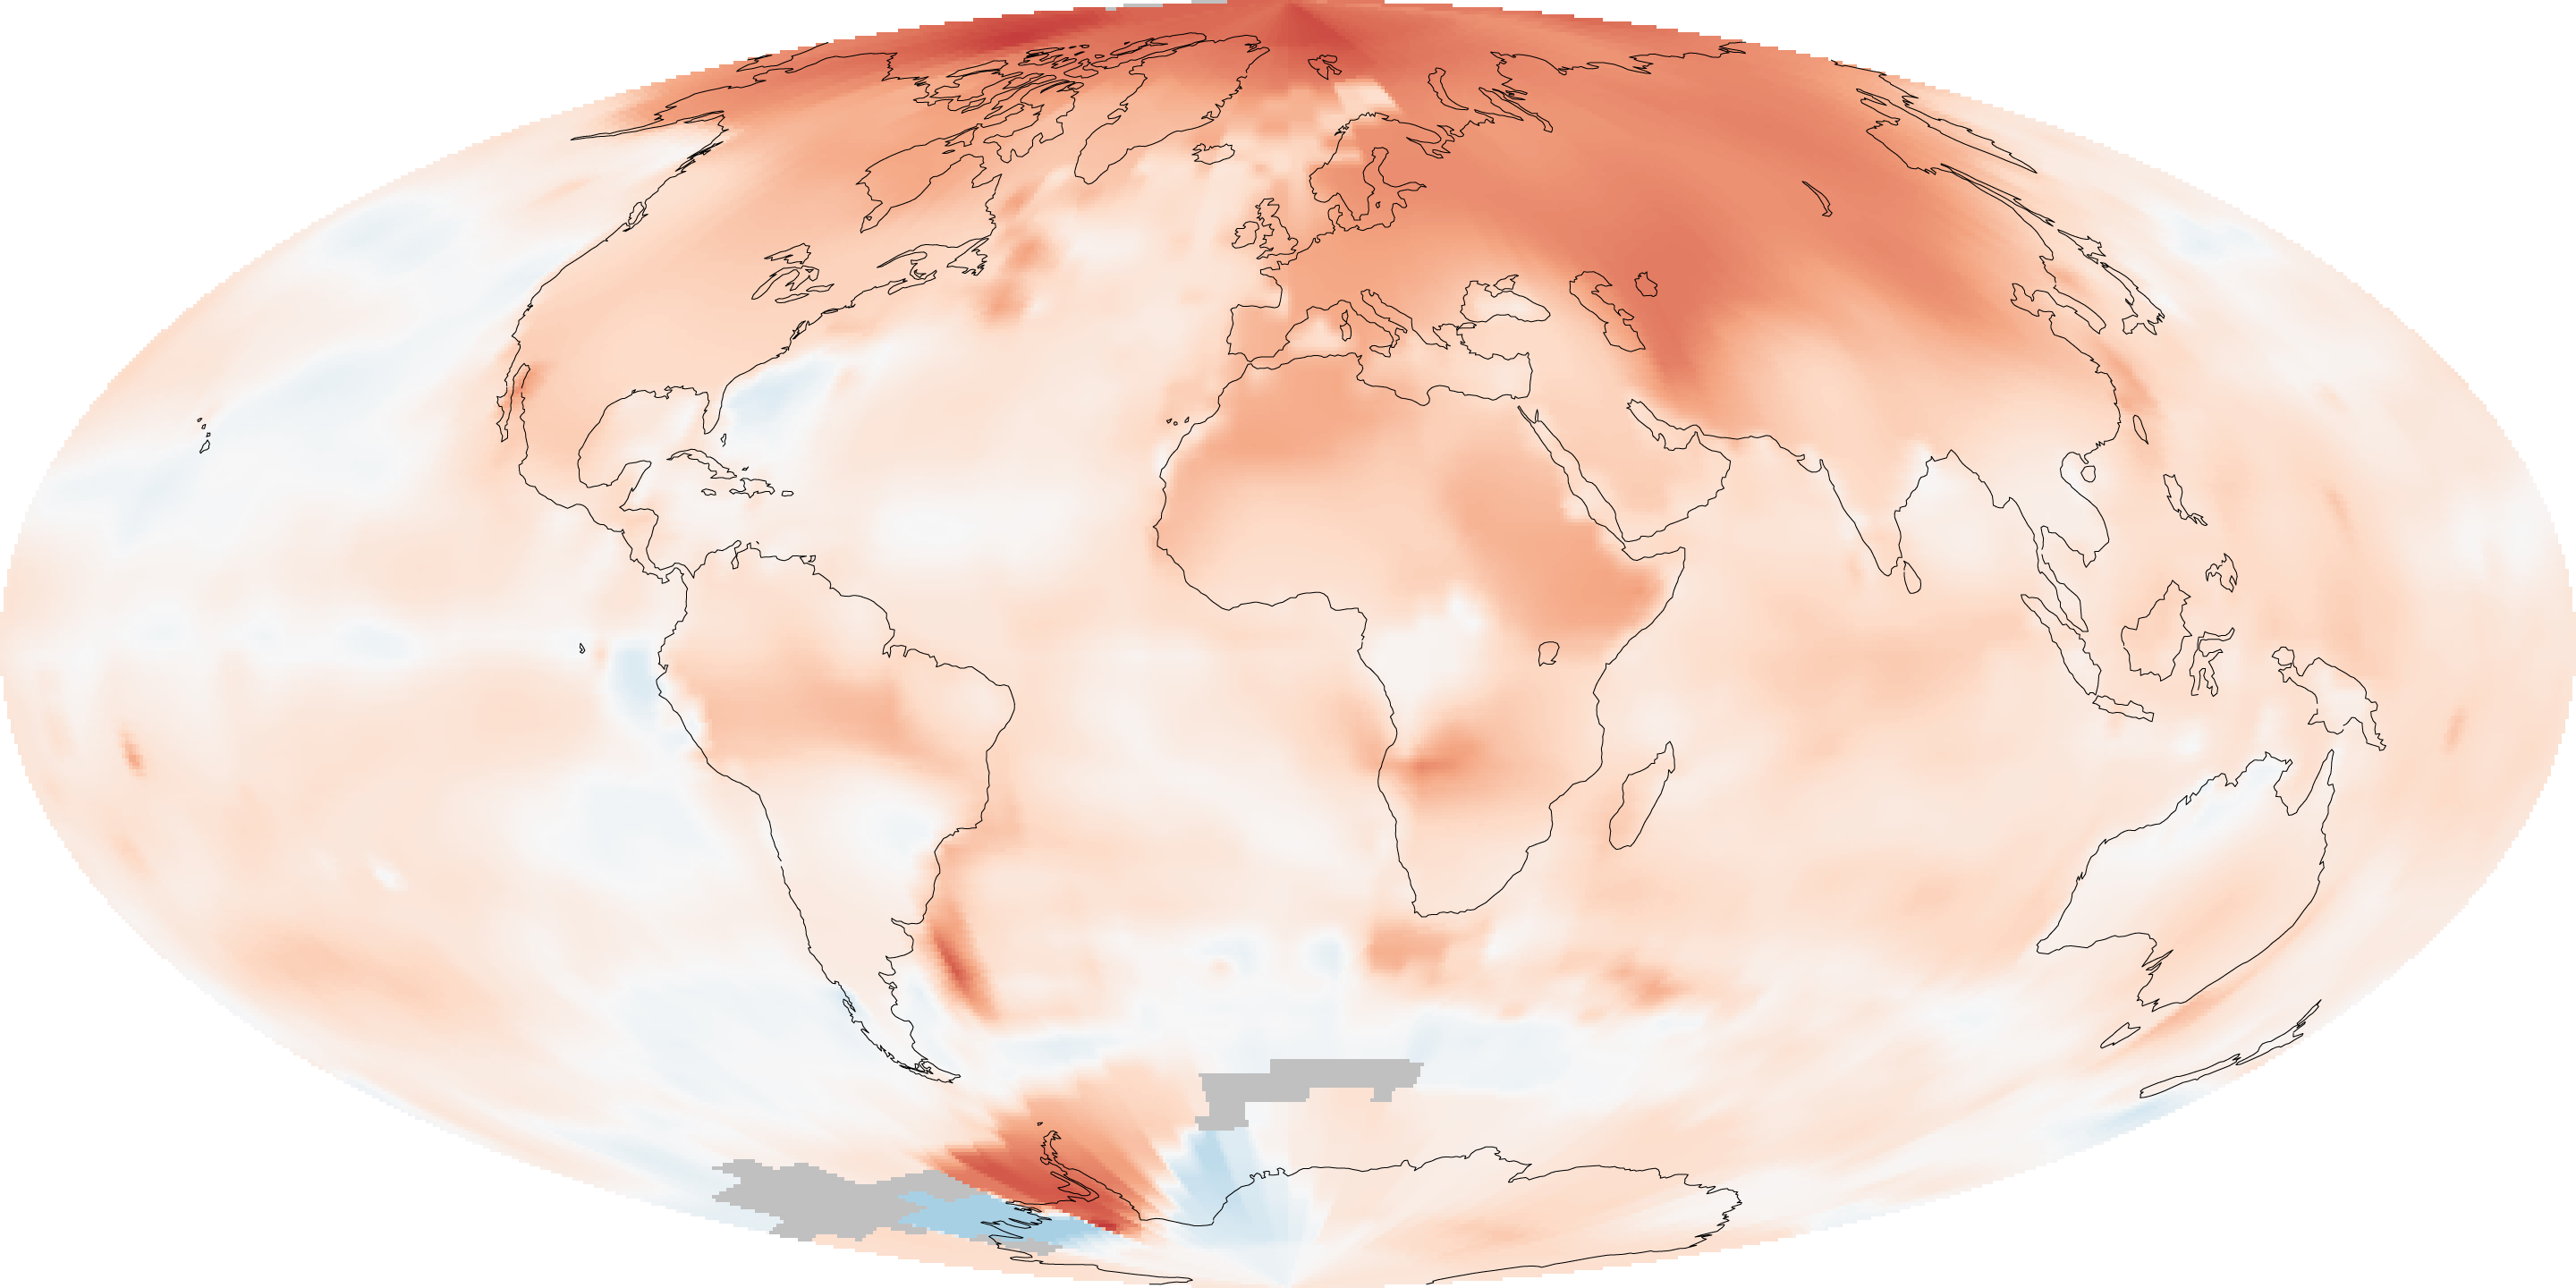
English: As far back as 1896, the Swedish scientist Svante Arrhenius hypothesized that changes in the concentration of carbon dioxide in Earth’s atmosphere could alter surface temperatures. He also suggested that changes would be especially large at high latitudes.
Arrhenius didn’t get every detail right, but his argument has proven to be rather sound. Since the mid-20th Century, average global temperatures have warmed about 0.6°C (1.1°F), but the warming has not occurred equally everywhere. Temperatures have increased about twice as fast in the Arctic as in the mid-latitudes, a phenomenon known as “Arctic amplification.” The map above shows global temperature anomalies for 2000 to 2009. It does not depict absolute temperature, but rather how much warmer or colder a region is compared to the norm for that region from 1951 to 1980. Global temperatures from 2000–2009 were on average about 0.6°C higher than they were from 1951–1980. The Arctic, however, was about 2°C warmer. Why are temperatures warming faster in the Arctic than the rest of the world? The loss of sea ice is one of the most cited reasons. When bright and reflective ice melts, it gives way to a darker ocean; this amplifies the warming trend because the ocean surface absorbs more heat from the Sun than the surface of snow and ice. In more technical terms, losing sea ice reduces Earth’s albedo: the lower the albedo, the more a surface absorbs heat from sunlight rather than reflecting it back to space. However, other factors contribute as well, explained Anthony Del Genio, a climatologist from NASA’s Goddard Institute for Space Studies. Thunderstorms, for instance, are much more likely to occur in the tropics than the higher latitudes. The storms transport heat from the surface to higher levels of the atmosphere, where global wind patterns sweep it toward higher latitudes. The abundance of thunderstorms creates a near-constant flow of heat away from the tropics, a process that dampens warming near the equator and contributes to Arctic amplification. |
| Date | |
| Source |
http://eoimages.gsfc.nasa.gov/images/imagerecords/81000/81214/GISS_temperature_2000-09_lrg.png http://earthobservatory.nasa.gov/IOTD/view.php?id=81214 |
| Author | NASA image by Robert Simmon, based on GISS surface temperature analysis data including ship and buoy data from the Hadley Centre. Caption by Adam Voiland. |
Licensing
[edit]
| This file is in the public domain in the United States because it was solely created by NASA. NASA copyright policy states that "NASA material is not protected by copyright unless noted". (See Template:PD-USGov, NASA copyright policy page or JPL Image Use Policy.) | ||
 |
Warnings:
|
File history
Click on a date/time to view the file as it appeared at that time.
| Date/Time | Thumbnail | Dimensions | User | Comment | |
|---|---|---|---|---|---|
| current | 16:48, 26 May 2013 | | 3,182 × 2,044 (806 KB) | Sagredo (talk | contribs) | User created page with UploadWizard |
You cannot overwrite this file.
File usage on Commons
The following 2 pages use this file: