File:Planetary habitability by ocean area 1 1.png
Original file (1,143 × 667 pixels, file size: 96 KB, MIME type: image/png)
Captions
Captions
Summary
[edit]
| Description |
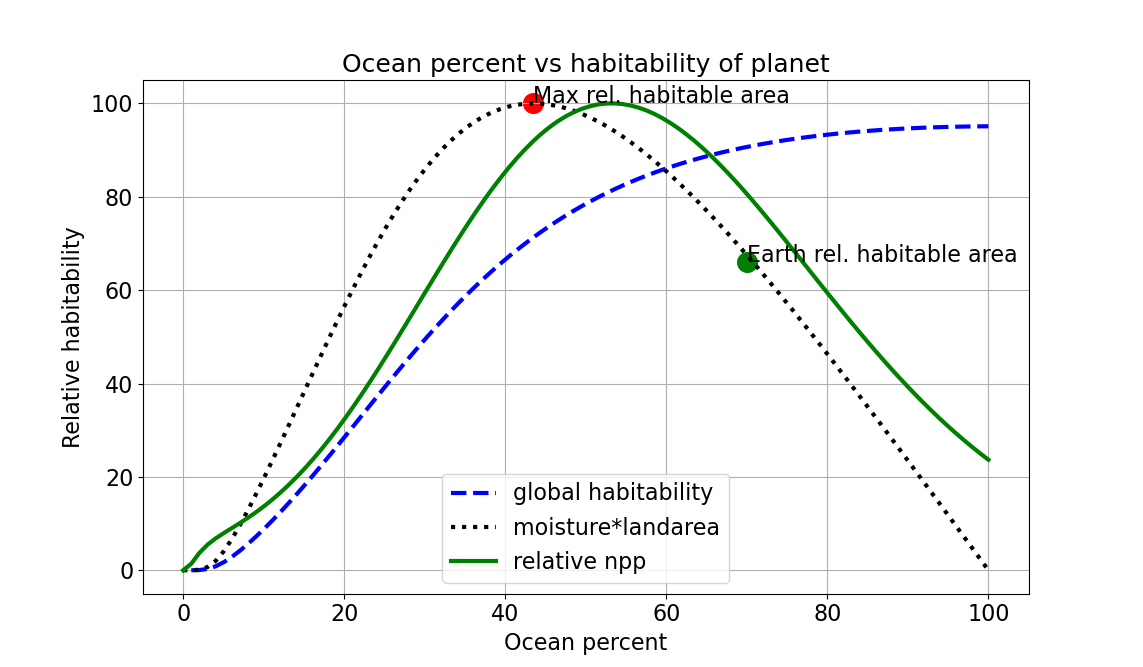
English: Planetary habitability by ocean percent. Assumed planet is otherwise near Earth-like, but percent of ocean area changes. |
| Date | |
| Source | Own work |
| Author | Merikanto |
Assumed Earth-like planet, Sun-like star. Planet nnear like Earth: M=1 Me, r=1 Re, P=1atm, S= near current, titl 23.5, ecc 0.013.
This image is based on SPH index of moisture and exoplasim simulations.
Source of data for moisture SPH
Abel Mendez
Evolution of the global terrestrial habitability during last century
PHRYSIG 2009
http://cohemisferico.uprm.edu/prysig/pdfs/pres_amendez09.pdf
Exoplasim
https://github.com/alphaparrot/ExoPlaSim
Code to plot
- habitability of planet vs ocena cover
- data from earth-like planet simulations with Exoplasim
- 27.06.2024 0000.0001
import math
import numpy as np
import matplotlib.pyplot as plt


def habitability_f_T_RH(T, RH):
   # https://phl.upr.edu/projects/standard-primary-habitability-sph
   #https://phl.upr.edu/projects/standard-primary-habitability-sph
   # Surface Temperature (°C) 	-8.3 	24.1 	39.0  	3.0
   # Relative Humidity (%) 	9.2 	77.5 	 100 	2.0
   # http://cohemisferico.uprm.edu/prysig/pdfs/pres_amendez09.pdf
   TOPT=273.15+24.1
   TMIN=273.15-8.3
   TMAX=273.15+39
   RHOPT=77.5
   RHMIN=9.2
   RHMAX=100
   ## vegetation
   TOPT=273.15+22.0
   TMIN=273.15-0.6
   TMAX=273.15+43.6
   RHOPT=93.1
   RHMIN=0
   RHMAX=100
   amin=T-TMIN
   amax=T-TMAX
   amean=np.power((T-TOPT),2)

   a1=amin*amax
   a2=a1-amean
   HTT=np.power((a1/a2),3)
   #if(T>TMAX): HTT=0
   #if(T<TMIN): HTT=0
   b1=RH-RHOPT
   b2=RH-RHMIN
   b3=np.power((b1/b2),2)
   HRH=np.power((1+b3), -1)
   #if(RH>RHMAX): HRH=0
   #if(RH<RHMIN): HRH=0

   #fhab=HTT
   #fhab=HRH
   fhab=HRH*HTT
   #fhab=HTT
   fhab=np.where(fhab<0,0, fhab)
   return(fhab)
def fit_log_poly(inx, iny, outx):
   logx=np.log10(inx)
   logy=np.log10(iny)
   logx2=np.log10(outx)
   #m,b = np.polyfit(logx, logy, 1)
   coef = np.polyfit(logx,logy,6)
   poly1d_fn = np.poly1d(coef)
   logy2=poly1d_fn(logx2)
   y2=np.power(10, logy2)
   return(y2)
def plot_rh_habitability_npp(oce2, habitability_sph_rh, relative_npp):
   #fox1=oceanpercents*rains
   fox2=((100-oce2)*hur2)/100
   fox3=land2*habitability_sph_rh
   fox3=np.nan_to_num(fox3,0)
   print(fox3)
   maxfox3=max(fox3)
   fox4=fox3/maxfox3
   fox4=fox4*100
   maxidx1=np.where(fox4==100)[0][0]
   maxocean1=oce2[maxidx1]
   earthoceandex1=np.where(oce2>70)[0][0]
   earthhab1=fox4[earthoceandex1]
   plt.plot(oce2, habitability_sph_rh*100, "--", lw=3, color="blue", label="global habitability")
   #plt.plot(oce2, relative_npp, "--", lw=3, color="blue", label="global habitability")
   plt.title("Ocean percent vs habitability of planet", size=18)
   plt.xlabel("Ocean percent", size=16)
   plt.ylabel("Relative habitability", size=16)
   plt.xticks(fontsize=16)
   plt.yticks(fontsize=16)
   plt.plot(oce2, fox4, lw=3, color="black", linestyle=":", label="moisture*landarea")

   plt.plot(oce2, relative_npp, lw=3, color="green", label="relative npp")
   plt.scatter(maxocean1, 100, s=200, color="red")
   plt.text(maxocean1, 100, "Max rel. habitable area", fontsize=16)
   plt.scatter(earthoceandex1, earthhab1, s=200, color="green")
   plt.text(earthoceandex1, earthhab1,  "Earth rel. habitable area", fontsize=16)
   plt.grid()
   plt.legend(fontsize=16)
   #plt.plot(fox2)
   plt.show()
- main program
- data from exoplasim simulations
- assumptions: 1 mearth, like earth, S=S earth now, obliquity etc near now
oceanpercents=np.array([4.3,30, 47.2,70, 90])
hurs=np.array([20,51, 65,76.7, 82])
rains=np.array([75,570, 822, 1073, 1223])
temps=np.array([6.64,16.56, 17.83, 19.06, 19.55])
npps=np.array([0.0081, 0.0674, 0.110, 0.0915, 0.0446])
landpercents=100-oceanpercents
oce2=np.linspace(0,100,100)
land2=100-oce2
inx=oceanpercents
iny=hurs
iny2=rains
iny3=temps
iny4=npps
outx=oce2


y2=fit_log_poly(inx, iny, outx)
y3=fit_log_poly(inx, iny2, outx)
y4=fit_log_poly(inx, iny3, outx)
y5=fit_log_poly(inx, iny4, outx)
hur2=y2
rain2=y3
temp2=y4
npp2=y5
T=temp2+273.15
- T=T*0+273.15+15
npp2=np.nan_to_num(npp2,0)
relative_npp=(100*npp2)/np.max(npp2)
print("NPPP")
print(npp2)
habitability_sph_rh=habitability_f_T_RH(T, hur2)


plot_rh_habitability_npp(oce2, habitability_sph_rh, relative_npp)
- plt.scatter(oceanpercents, rains)
- plt.plot(oce2,rain2)
- plt.plot(oce2, temp2)
- plt.plot(oce2, npp2)
plt.show()
Code to acquire data from exoplasim output, with Python xarray
import xarray as xr
import numpy as np
import math
iname1="MOST.00050.nc"
def calc_spatial_mean(xr_da, lon_name="lon", lat_name="lat"):
   coslat = np.cos(np.deg2rad(xr_da[lat_name]))
   return (xr_da * coslat).sum(dim=[lon_name, lat_name]) / (
       coslat.sum(lat_name) * len(xr_da[lon_name])
   )
ds = xr.open_dataset(iname1)
mean_tas = np.mean(np.array(calc_spatial_mean(ds.tas)))
lsm_mean=np.mean(np.array(calc_spatial_mean(ds.lsm)))
ocean=1-lsm_mean
vegnpp_mean=np.sum(np.array(calc_spatial_mean(ds.vegnpp)))*3600*24*30.5
vegf_mean=np.mean(np.array(calc_spatial_mean(ds.vegf)))
veglai_mean=np.mean(np.array(calc_spatial_mean(ds.vegf)))
mean_clt=np.array(calc_spatial_mean(ds.clt))
mean_pr=np.array(calc_spatial_mean(ds.pr))*3600*24*30.5*1000
mean_pr2=np.sum(mean_pr)
mean_clt2=np.mean(mean_clt)
mean_hur=np.array(calc_spatial_mean(ds.hur))
mean_hur2=mean_hur[:,9]
mean_hur3=np.mean(mean_hur2)
print("tas ",mean_tas-273.15)
print("land ", lsm_mean)
print("ocean", ocean)
print("pr ", mean_pr2)
print("hur ",mean_hur3)
print("clt ",mean_clt2)
print("vegf ", vegf_mean)
print("npp ", vegnpp_mean)
print("lai", veglai_mean)
- mean_hur_a=np.mean(np.array(calc_spatial_mean(ds.hur[10])))
mean_tas2=np.array(mean_tas)
mean_tas3=np.mean(mean_tas2)
- print (mean_tas3-273.15)
- print(mean_hur_a)
Code to run exoplasim
-
- exoplasim planet runner
- python 3, exoplasim
- basic run settings T21
-
- 29.10.2023 0000.0002a2
-
import math
import numpy as np
import exoplasim as exo
timestep=30.0
years=100
Sol=1361.5
- basic input params
startemp=5780 # assumption Earth-like
- Gliese 12 b
planetname="TEST1"
S1=1.0
flux=S1*Sol
year=360
rotationperiod=1
radius=1 ## rel to earth
mass=math.pow(radius, 3.7)
eccentricity=0.013
obliquity=23.5
fixedorbit=True
synchronous=False
- substellarlon=0
substellarlon=180
aquaplanet=False
desertplanet=False
vegetation=2 ## 0 no 1 static 2 dynamic
stormclim=False
aerosol=False
co2weathering=False
outgassing=0
evolveco2=False
maxsnow=-1 ## False ?
ozone=False
vegaccel=1
seaice=False
wetsoil=False
glaciers1= {
	"toggle": True,
	"mindepth":2,
	"initialh":-1
}
- landmap="Alderaan_surf_0129.sra"
- topomap="Alderaan_surf_0172.sra"
- landmap=None
- topomap=None
landmap="mapa_surf_0129.sra"
topomap="mapa_surf_0172.sra"
- relCO2=0.95
- relN2=1-relCO2
relCO2=280e-6
relO2=0.21
relN2=1-relCO2-relO2
- relCO2=0.95
- relO2=0.045
- relN2=1-relCO2-relO2
density=mass/np.power(radius,3)*5.519
vesc=np.sqrt(mass/radius)*11.186
geese=mass/(radius*radius)
geeseg=geese*9.80665
patm1=geese*mass*radius*radius ## estimation
patm2=math.pow(radius, 2.4)
gravity=geeseg
pressure=(patm1+patm2)/2
- pressure=10
- pressure=0.1
pN2=pressure*relN2
pCO2=pressure*relCO2
pO2=pressure*relO2
print(" Name      ", planetname)
print(" insol S0  ",round(S1,3) )
print(" insol Wm2 ",round(flux,2) )
print(" mass      ",round(mass,2) )
print(" radius    ",round(radius,2) )
print(" radius km ",round((radius*6371),2) )
print(" density   ",round(density,2) )
print(" vesc      ",round(vesc,2) )
print(" gee_e     ",round(geese,2) )
print(" gee_ms2   ",round((geese*9.81),2) )
print(" Patm      ",round(pressure,6) )
print("Running wait long time ...")
- quit(-1)
planeta = exo.Model(workdir="planeta_run",modelname="Planeta",ncpus=4,resolution="T21",outputtype=".nc")


planeta.configure(year=year, wetsoil=wetsoil,pO2=pO2, ozone=ozone, vegaccel=vegaccel, seaice=seaice, glaciers=glaciers1, maxsnow=maxsnow, evolveco2=evolveco2, outgassing=outgassing, co2weathering=co2weathering, vegetation=vegetation, stormclim=stormclim, aerosol=aerosol,landmap=landmap, topomap=topomap,startemp=startemp, flux=flux, eccentricity=eccentricity,obliquity=obliquity,fixedorbit=fixedorbit,synchronous=synchronous,substellarlon=substellarlon,rotationperiod=rotationperiod,radius=radius,gravity=gravity,aquaplanet=aquaplanet,desertplanet=desertplanet,pN2=pN2,pCO2=pCO2,timestep=timestep,snapshots=False,physicsfilter="gp|exp|sp")
print(" Run, wait a long time...")
planeta.run(years=years,crashifbroken=True)
planeta.exportcfg()
planeta.run(years=years,crashifbroken=True)
planeta.finalize("Planeta",allyears=True,keeprestarts=True)
planeta.save()
Code to make maps. Noue you must adjust manually
- 3
-
- diku "planet map generator" map converter to exoplasim input test
- maps from https://topps.diku.dk/torbenm/maps.msp
- must use here grayscale palette output option !
- normalizes map to 0...1, then np.exp(z), then normalize to depest and highest points
- python3 source code
-
- 24.6.2024 v 0000.0000c2
-
import os
import math as math
import numpy as np
from scipy.interpolate import interp2d
import matplotlib.pyplot as plt
from PIL import Image, ImageFilter
from imageio import imwrite
import imageio
import netCDF4
- import exoplasim as exo
- main ctrls
iname1="MapU-111.bmp" ## diku seed 11111 sea level -0.05 wrinky
- top1=7000
- floor1=-8000
top1=8000
floor1=-8000
land_height_scaling_exponent_1=3 ## land height scaling exponent 15 16 tex
sealevel1=0.055 ## if land scaling exponent hight mush use here small value! level in original bittmap 0...1
def t21_meanz(inmap):
latitudes0=np.array([85.7606, 80.2688, 74.7445, 69.2130, 63.6786, 58.1430, 52.6065, 47.0696,
	41.5325,35.9951, 30.4576, 24.9199, 19.3822, 13.8445, 8.3067, 2.7689,
	-2.7689, -8.3067, -13.8445, -19.3822, -24.9199, -30.4576, -35.9951, -41.5325,
	-47.0696, -52.6065, -58.1430, -63.6786, -69.2130, -74.7445, -80.2688, -85.7606])
   radlats1=np.radians(latitudes0)
   coslats1=np.cos(radlats1)
   height1=len(radlats1)
   seas1=0
   all1=0
   landmeanz1=0
   for iy in range(0,(height1)):
       line1=inmap[iy,:]
       lek1=abs(coslats1[iy])
       seadd0=np.count_nonzero(line1 == 0)
       #print(seadd0)
       seadd1=seadd0/len(line1)
       seadd2=lek1*seadd1
       seas1=seas1+seadd2
       all1=all1+lek1
       lamez0=line1[line1>0].mean()
       if (math.isnan(lamez0)): lamez0=0
       lamez1=lamez0*lek1
       landmeanz1=landmeanz1+lamez1
landmeanz2=round((landmeanz1/height1),2)
   seapercent2=round(((seas1*100)/all1),2)
   landpercent2=100-seapercent2
   #print(seas1)
   #print(all1)
   #print(seapercent2)
   #print(landpercent2)
   return(landpercent2, seapercent2, landmeanz2)
def count_spherical_land_sea_meanz(inmap):
   radlats1=np.linspace(-np.pi/2,np.pi, height1)
   coslats1=np.cos(radlats1)
   seas1=0
   all1=0
   landmeanz1=0
   for iy in range(0,(height1)):
       line1=inmap[iy,:]
       lek1=abs(coslats1[iy])
       seadd0=np.count_nonzero(line1 == 0)
       #print(seadd0)
       seadd1=seadd0/len(line1)
       seadd2=lek1*seadd1
       seas1=seas1+seadd2
       all1=all1+lek1
       lamez0=line1[line1>0].mean()
       if (math.isnan(lamez0)): lamez0=0
       lamez1=lamez0*lek1
       landmeanz1=landmeanz1+lamez1
landmeanz2=round((landmeanz1/height1),2)
   seapercent2=round(((seas1*100)/all1),2)
   landpercent2=100-seapercent2
   #print(seas1)
   #print(all1)
   #print(seapercent2)
   #print(landpercent2)
   return(landpercent2, seapercent2, landmeanz2)
def writeSRA(name,kcode,field,NLAT,NLON):
   label=name+'_surf_%04d.sra'%kcode
   header=[kcode,0,20170927,0,NLON,NLAT,0,0]
   fmap = field.reshape((int(NLAT*NLON/8),8))
   sheader =
   for h in header:
       sheader+=" %11d"%h

   lines=[]
   i=0
   while i<NLAT*NLON/8:
       l=
       for n in fmap[i,:]:
           l+=' %9.3f'%n
       lines.append(l)
       i+=1
text=sheader+'\n'+'\n'.join(lines)+'\n'
   f=open(label,'w')
   f.write(text)
   f.close()
   #print (label)
def writeSRA2(label,kcode,field,NLAT,NLON):
   #label=name+'_surf_%04d.sra'%kcode
   header=[kcode,0,20170927,0,NLON,NLAT,0,0]
   fmap = field.reshape((int(NLAT*NLON/8),8))
   sheader =
   for h in header:
       sheader+=" %11d"%h

   lines=[]
   i=0
   while i<NLAT*NLON/8:
       l=
       for n in fmap[i,:]:
           l+=' %9.3f'%n
       lines.append(l)
       i+=1
text=sheader+'\n'+'\n'.join(lines)+'\n'
   f=open(label,'w')
   f.write(text)
   f.close()
   print (label)
def savenetcdf_single_frommem(outfilename1, outvarname1, xoutvalue1,xoutlats1,xoutlons1):
	nlat1=len(xoutlats1)
	nlon1=len(xoutlons1)
	#indata_set1=indata1
	#print(outfilename1)
	ncout1 = netCDF4.Dataset(outfilename1, 'w', format='NETCDF4')
	outlat1 = ncout1.createDimension('lat', nlat1)
	outlon1 = ncout1.createDimension('lon', nlon1)
	outlats1 = ncout1.createVariable('lat', 'f4', ('lat',))
	outlons1 = ncout1.createVariable('lon', 'f4', ('lon',))
	outvalue1 = ncout1.createVariable(outvarname1, 'f4', ('lat', 'lon',))
	outvalue1.units = 'Unknown'
	outlats1[:] = xoutlats1
	outlons1[:] = xoutlons1
	outvalue1[:, :] =xoutvalue1[:]
	ncout1.close()
	return 0
def loadnetcdf_single_tomem(infilename1, invarname1):
	global cache_lons1
	global cache_lats1
	#print(infilename1)
	inc1 = netCDF4.Dataset(infilename1)
	inlatname1="lat"
	inlonname1="lon"
	inlats1=inc1[inlatname1][:]
	inlons1=inc1[inlonname1][:]
	cache_lons1=inlons1
	cache_lats1=inlats1
	indata1_set1 = inc1[invarname1][:]
	dim1=indata1_set1.shape
	nlat1=dim1[0]
	nlon1=dim1[1]
	inc1.close()
	return (indata1_set1)
def create_sras(topo, seamasklevel1):
	global NLAT
	global NLON


	topo2=np.copy(topo)
	seamasklevel2=seamasklevel1+1.0
	topo2[topo2 < seamasklevel1] = seamasklevel1
	masko=np.copy(topo2)
	masko[masko == seamasklevel1] = -9999999
	masko[masko > seamasklevel1] = 1
	masko[masko ==  -9999999 ] = 0
	grid=np.flipud(masko)
	name="Example"
	writeSRA(name,129,topo,NLAT,NLON)
	writeSRA(name,172,grid,NLAT,NLON)
	writeSRA2("topo.sra",129,topo2,NLAT,NLON)
	writeSRA2("landmask.sra",172,grid,NLAT,NLON)
	return(0)
def conv_t21(infilename1, outfilename1, seamasklevel1):
	global NLAT
	global NLON
	#indimx=361
	#indimy=181
	#indimx=360
	#indimy=360
	## t21 64x32
	shapex=64
	shapey=32
	NLAT=shapex
	NLON=shapey
	nc = netCDF4.Dataset(infilename1)
	inlats=nc['lat'][:]
	inlons=nc['lon'][:]
	#print(inlats)
	#print(inlons)
	indimx=len(inlons)
	indimy=len(inlats)


	latlen=len(inlats)
	lonlen=len(inlons)


	#print(lonlen, latlen)
	indimx=lonlen
	indimy=latlen
	dem000=nc['z']
	#dem=np.flipud(dem000)
	dem=np.copy(dem000)
	dem2=np.copy(dem)
	#dem2[dem2 < 0] = 0
	#plt.imshow(dem,cmap='gist_earth')
	#plt.imshow(dem2,cmap='gist_earth')
	#plt.show()
	#quit(0)
	lts0=[85.7606, 80.2688, 74.7445, 69.2130, 63.6786, 58.1430, 52.6065, 47.0696,
	41.5325,35.9951, 30.4576, 24.9199, 19.3822, 13.8445, 8.3067, 2.7689,
	-2.7689, -8.3067, -13.8445, -19.3822, -24.9199, -30.4576, -35.9951, -41.5325,
	-47.0696, -52.6065, -58.1430, -63.6786, -69.2130, -74.7445, -80.2688, -85.7606]
	##
	lns0=[0, 5.6250, 11.2500, 16.8750, 22.5000, 28.1250, 33.7500 ,39.3750,
	45.0000, 50.6250, 56.2500, 61.8750, 67.5000, 73.1250, 78.7500, 84.3750,
	90.0000, 95.6250, 101.2500, 106.8750, 112.5000, 118.1250, 123.7500, 129.3750,
	135.0000, 140.6250, 146.2500, 151.8750, 157.5000, 163.1250, 168.7500, 174.3750,
	180.0000, 185.6250, 191.2500, 196.8750, 202.5000, 208.1250, 213.7500, 219.3750,
	225.0000, 230.6250, 236.2500, 241.8750, 247.5000, 253.1250, 258.7500, 264.3750,
	270.0000, 275.6250, 281.2500, 286.8750, 292.5000, 298.1250, 303.7500, 309.3750,
	315.0000, 320.6250, 326.2500, 331.8750, 337.5000, 343.1250, 348.7500, 354.3750]
	lts1=np.array(lts0)
	lns1=np.array(lns0)
	lns=lns1
	lts=np.flip(lts1)
	ly2=len(lts)
	lx2=len(lns)
	shapex=lx2
	shapey=ly2
	#print("sheip")
	#print(shapex, shapey)


	lons, lats = np.meshgrid(lns,lts)
	#print (lts)
	#print (lns)
	new_W, new_H = (shapey,shapex)
	xrange = lambda x: np.linspace(0, 360, x)
	f2 = interp2d(xrange(indimx), xrange(indimy), dem2, kind="linear")
	#f2 = interp2d(range(indimx), range(indimy), dem2, kind="cubic")
	demo = f2(xrange(shapex), xrange(shapey))
	#plt.imshow(demo)
	#plt.show()
	#quit(0)
	f3 = interp2d(xrange(indimx), xrange(indimy), dem2, kind="linear")
	#masko = f3(xrange(shapex), xrange(shapey))
	#topo=np.flipud(demo)
	topo=np.copy(demo)
	topo2=np.copy(topo)
	masko=np.copy(topo)
	seamasklevel2=seamasklevel1+1.0
	topo2[topo2 < seamasklevel1] = seamasklevel1
	masko=np.copy(topo2)
	masko[masko == seamasklevel1] = -9999999
	masko[masko > seamasklevel1] = 1
	masko[masko ==  -9999999 ] = 0
	#plt.imshow(demo)
	#plt.imshow(masko)
	#plt.imshow(topo2)
	#plt.show()
	#grid=np.fliplr(masko)
	#def savenetcdf_single_frommem(outfilename1, outvarname1, xoutvalue1,xoutlats1,xoutlons1):
	savenetcdf_single_frommem(outfilename1, "z", topo,lts,lns)
	savenetcdf_single_frommem("mapt21.nc", "z", topo2,lts,lns)
	savenetcdf_single_frommem("maskt21.nc", "z", masko,lts,lns)
	landpercent2, seapercent2, landmeanz2=t21_meanz(topo2)
	print("")
	print("Output T21 dem \n Land %       ", landpercent2, "\n Mean land z  ", landmeanz2)
	#savenetcdf_single_frommem("maskt21.nc", "z", masko,lts,lns)
	writeSRA("mapa",129,np.flipud(topo2),NLAT,NLON)
	writeSRA("mapa",172,np.flipud(masko),NLAT,NLON)
	return(topo,lons,lats)
def savenetcdf2(outfilename1, outvarname1, map1):
	shape1=np.shape(map1)
	width1=shape1[1]
	height1=shape1[0]
	xoutlons1=np.linspace(0,360,width1)
	xoutlats1=np.linspace(-90,90, height1)
	nlat1=len(xoutlats1)
	nlon1=len(xoutlons1)
	#indata_set1=indata1
	print(outfilename1)
	ncout1 = netCDF4.Dataset(outfilename1, 'w', format='NETCDF4')
	outlat1 = ncout1.createDimension('lat', nlat1)
	outlon1 = ncout1.createDimension('lon', nlon1)
	outlats1 = ncout1.createVariable('lat', 'f4', ('lat',))
	outlons1 = ncout1.createVariable('lon', 'f4', ('lon',))
	outvalue1 = ncout1.createVariable(outvarname1, 'f4', ('lat', 'lon',))
	outvalue1.units = 'Unknown'
	outlats1[:] = xoutlats1
	outlons1[:] = xoutlons1
	outvalue1[:, :] =np.flipud(map1[:])
	ncout1.close()
	return 0
- main program
NLAT=0
NLON=0


imin1=Image.open(iname1)
img1 = np.asarray(imin1).astype(float)
max1=np.max(img1)
min1=np.min(img1)
del1=max1-min1
map0=(img1-min1)/del1
- map1=np.exp(map0)/np.exp(1)
map1a=np.copy(map0)
- land_height_scaling_exponent_1=15
map1a=np.power(map1a, land_height_scaling_exponent_1)
max2=np.max(map1a)
min2=np.min(map1a)
del2=max2-min2
map1=(map1a-min2)/del2
map1=map1[:,:,0]
shape1=np.shape(map1)
width1=shape1[1]
height1=shape1[0]
imsize1=width1*height1
- quit(-1)
map2=np.copy(map1)
map3=np.copy(map1)
map2=np.where(map2<sealevel1,0,map2)
map2=np.where(map2<sealevel1,map2*floor1,map2*top1)
- abyss mat too ...
map3=np.where(map3<sealevel1,map3*floor1,map3*top1)
landpixels1=np.count_nonzero(map2)
landpercent1=round( ((landpixels1*100)/imsize1),1)
- quit(-1)
landpercent2, seapercent2, landmeanz2=count_spherical_land_sea_meanz(map2)
- map2a=(np.abs(map2)*256*256).astype(np.uint16)
map2a=map2
- print (np.max(map2a))
- quit(-1)
- print(map2a)
- quit(-1)
imout1 = Image.fromarray(map2a)
imageio.imwrite('map2.png', map2a.astype(np.uint16))
- imout1.save("map1.png")
- quit(-1)
map3=np.roll(map2a, int(width1/2), axis=1)
plt.imshow(map3)
plt.show()
- imout2 = Image.fromarray(map3)
imageio.imwrite('map1.png', map3.astype(np.uint16))
mask2=np.copy(map2a)
mask3=np.copy(map3)
mask2=np.where(mask2<1,0, 65535)
mask3=np.where(mask3<1,0, 65535)
- imout3 = Image.fromarray(mask2)
- imout4 = Image.fromarray(mask3)
imageio.imwrite('mask2.png', mask2.astype(np.uint16))
imageio.imwrite('mask1.png', mask3.astype(np.uint16))
image1 = Image.open("mask1.png")
image1 = image1.convert("L")
image1 = image1.filter(ImageFilter.FIND_EDGES)
image1.save("edge1.png")
image2 = Image.open("mask2.png")
image2 = image2.convert("L")
image2 = image2.filter(ImageFilter.FIND_EDGES)
image2.save("edge2.png")
savenetcdf2("map1.nc", "z", map2a)
print()
print()
print()
print("Output coarse map params:")
conv_t21("map1.nc", "inmap", 0)
- print(width1, height1)
- print(" Land %" , landpercent1)
print()
print("Accurate dem")
print(" Land            % ", landpercent2)
print(" Sea             % ", seapercent2)
print(" Land mean height  ", landmeanz2)
print(".")
Licensing
[edit]
- You are free:
- to share – to copy, distribute and transmit the work
- to remix – to adapt the work
- Under the following conditions:
- attribution – You must give appropriate credit, provide a link to the license, and indicate if changes were made. You may do so in any reasonable manner, but not in any way that suggests the licensor endorses you or your use.
File history
Click on a date/time to view the file as it appeared at that time.
| Date/Time | Thumbnail | Dimensions | User | Comment | |
|---|---|---|---|---|---|
| current | 06:16, 27 June 2024 | | 1,143 × 667 (96 KB) | Merikanto (talk | contribs) | Update |
| 17:47, 26 June 2024 |  | 1,081 × 720 (79 KB) | Merikanto (talk | contribs) | Update of data | |
| 14:09, 26 June 2024 |  | 1,117 × 619 (79 KB) | Merikanto (talk | contribs) | Uploaded own work with UploadWizard |
You cannot overwrite this file.
File usage on Commons
There are no pages that use this file.