File:Philips60.png
Jump to navigation
Jump to search

Size of this preview: 800 × 566 pixels. Other resolutions: 320 × 226 pixels | 640 × 453 pixels | 1,024 × 724 pixels | 1,123 × 794 pixels.
Original file (1,123 × 794 pixels, file size: 27 KB, MIME type: image/png)
Captions
Captions
Add a one-line explanation of what this file represents
Summary
[edit]
| Description |
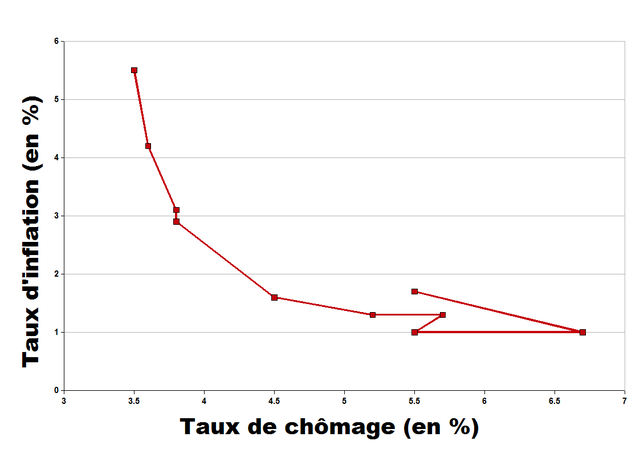
English: Relationship between the inflation rate and the unemployment rate (Philips Curve) in the US 1960-1969. Data from the U.S. Bureau Of Labor Statistics. Each dot is one year.
Français : Relation entre le taux d'inflation et le taux de chômage (courbe de Philips) aux Etats-Unis entre 1960 et 1969. Données du Bureau of Labor Statistics. Inflation et chômage en moyenne annuelle. Chaque point représente une année. |
| Source | Own work |
| Author | Gedefr |
| Other versions | english version/version anglaise |

|
This graph image could be re-created using vector graphics as an SVG file. This has several advantages; see Commons:Media for cleanup for more information. If an SVG form of this image is available, please upload it and afterwards replace this template with
{{vector version available|new image name}}.
It is recommended to name the SVG file “Philips60.svg”—then the template Vector version available (or Vva) does not need the new image name parameter. |
Licensing
[edit]
I, the copyright holder of this work, hereby publish it under the following licenses:

|
Permission is granted to copy, distribute and/or modify this document under the terms of the GNU Free Documentation License, Version 1.2 or any later version published by the Free Software Foundation; with no Invariant Sections, no Front-Cover Texts, and no Back-Cover Texts. A copy of the license is included in the section entitled GNU Free Documentation License. |
This file is licensed under the Creative Commons Attribution-Share Alike 3.0 Unported, 2.5 Generic, 2.0 Generic and 1.0 Generic license.
- You are free:
- to share – to copy, distribute and transmit the work
- to remix – to adapt the work
- Under the following conditions:
- attribution – You must give appropriate credit, provide a link to the license, and indicate if changes were made. You may do so in any reasonable manner, but not in any way that suggests the licensor endorses you or your use.
- share alike – If you remix, transform, or build upon the material, you must distribute your contributions under the same or compatible license as the original.
You may select the license of your choice.
File history
Click on a date/time to view the file as it appeared at that time.
| Date/Time | Thumbnail | Dimensions | User | Comment | |
|---|---|---|---|---|---|
| current | 04:43, 23 February 2009 | | 1,123 × 794 (27 KB) | Gedefr (talk | contribs) | {{Information |Description={{en|1=Relation between the inflation rate and the unemployment rate (Philips Curve) in the US 1960-1969. Data from the U.S. Bureau Of Labor Statistics. Each dot is one year.}} {{fr|1=Relation entre le taux d'inflation et le tau |
You cannot overwrite this file.
File usage on Commons
There are no pages that use this file.
File usage on other wikis
The following other wikis use this file:
- Usage on fr.wikipedia.org
- Usage on fr.wikibooks.org
- Usage on fr.wikiversity.org