File:Phase-diag de.svg
Jump to navigation
Jump to search

Size of this PNG preview of this SVG file: 575 × 443 pixels. Other resolutions: 312 × 240 pixels | 623 × 480 pixels | 997 × 768 pixels | 1,280 × 986 pixels | 2,560 × 1,972 pixels.
Original file (SVG file, nominally 575 × 443 pixels, file size: 16 KB)
Captions
Captions
Add a one-line explanation of what this file represents
| Description |
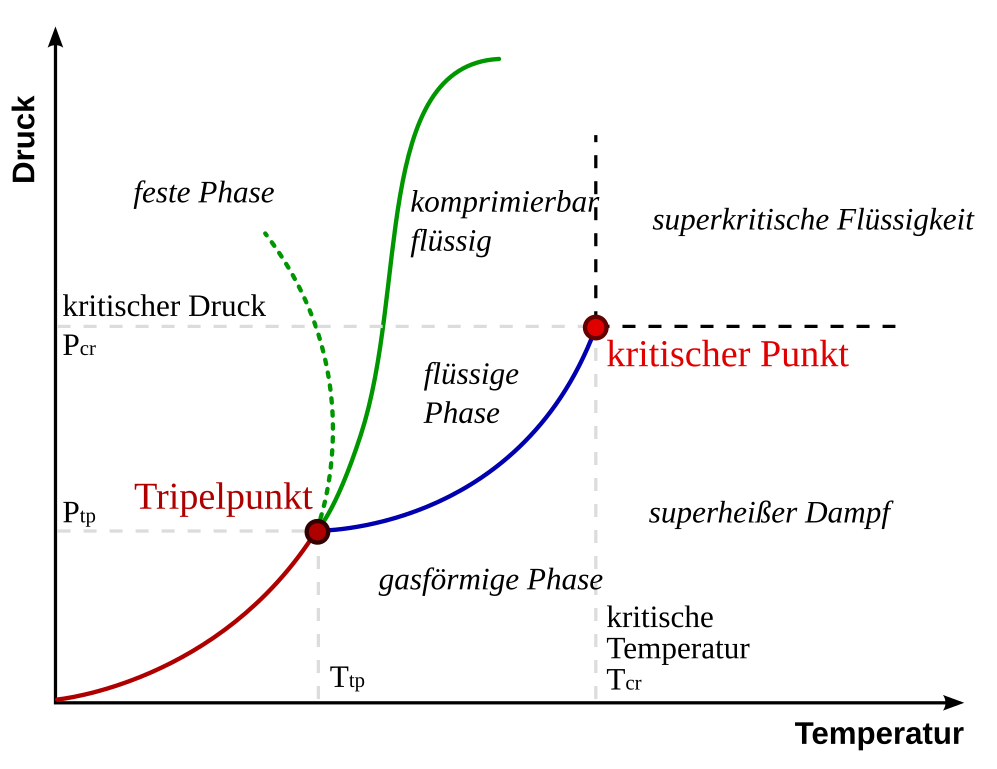
Deutsch: Ein typisches Phasendiagramm für ein einzelnes Material, die feste, flüssige und gasförmige Phase herausstellend. Die durchgezogene grüne Linie zeigt die übliche Form einer flüssig-fest-Phasen-Linie. Die gepunktete grüne Linie zeigt das anomale Verhalten von Wasser. English: A typical phase diagram for a single-component material, exhibiting solid, liquid and gaseous phases. The solid green line shows the usual shape of the liquid-solid phase line. The dotted green line shows the anomalous behavior of water. |
| Date | (UTC) |
| Source | |
| Author |
|
| Other versions |
[]
With a more realistic melting curve for ice:
|


| This is a retouched picture, which means that it has been digitally altered from its original version. Modifications: translated. The original can be viewed here: Phase-diag.svg:
|

|
Permission is granted to copy, distribute and/or modify this document under the terms of the GNU Free Documentation License, Version 1.2 or any later version published by the Free Software Foundation; with no Invariant Sections, no Front-Cover Texts, and no Back-Cover Texts. A copy of the license is included in the section entitled GNU Free Documentation License. |
Original upload log
[edit]
This image is a derivative work of the following images:
- File:Phase-diag.svg licensed with GFDL
- 2007-02-25T15:11:34Z EnEdC 575x443 (16824 Bytes) Add over-critical labels from [[:Image:Phase diagram.png]]
- 2006-06-08T07:28:26Z Booyabazooka 575x398 (12124 Bytes)
Uploaded with derivativeFX
File history
Click on a date/time to view the file as it appeared at that time.
| Date/Time | Thumbnail | Dimensions | User | Comment | |
|---|---|---|---|---|---|
| current | 09:28, 8 November 2009 | | 575 × 443 (16 KB) | Sebastian Wallroth (talk | contribs) | {{Information |Description={{de|Ein typisches Phasendiagramm für ein einzelnes Material, die feste, flüssige und gasförmige Phase herausstellend. Die durchgezogene grüne Linie zeigt die übliche Form einer flüssig-fest-Phasen-Linie. Die gepunktete gr |
You cannot overwrite this file.
File usage on Commons
The following 8 pages use this file: