File:Pearson type VII distribution log-PDF.svg
Jump to navigation
Jump to search

Size of this PNG preview of this SVG file: 400 × 300 pixels. Other resolutions: 320 × 240 pixels | 640 × 480 pixels | 1,024 × 768 pixels | 1,280 × 960 pixels | 2,560 × 1,920 pixels.
Original file (SVG file, nominally 400 × 300 pixels, file size: 132 KB)
Captions
Captions
Add a one-line explanation of what this file represents
Summary
[edit]
| Description |
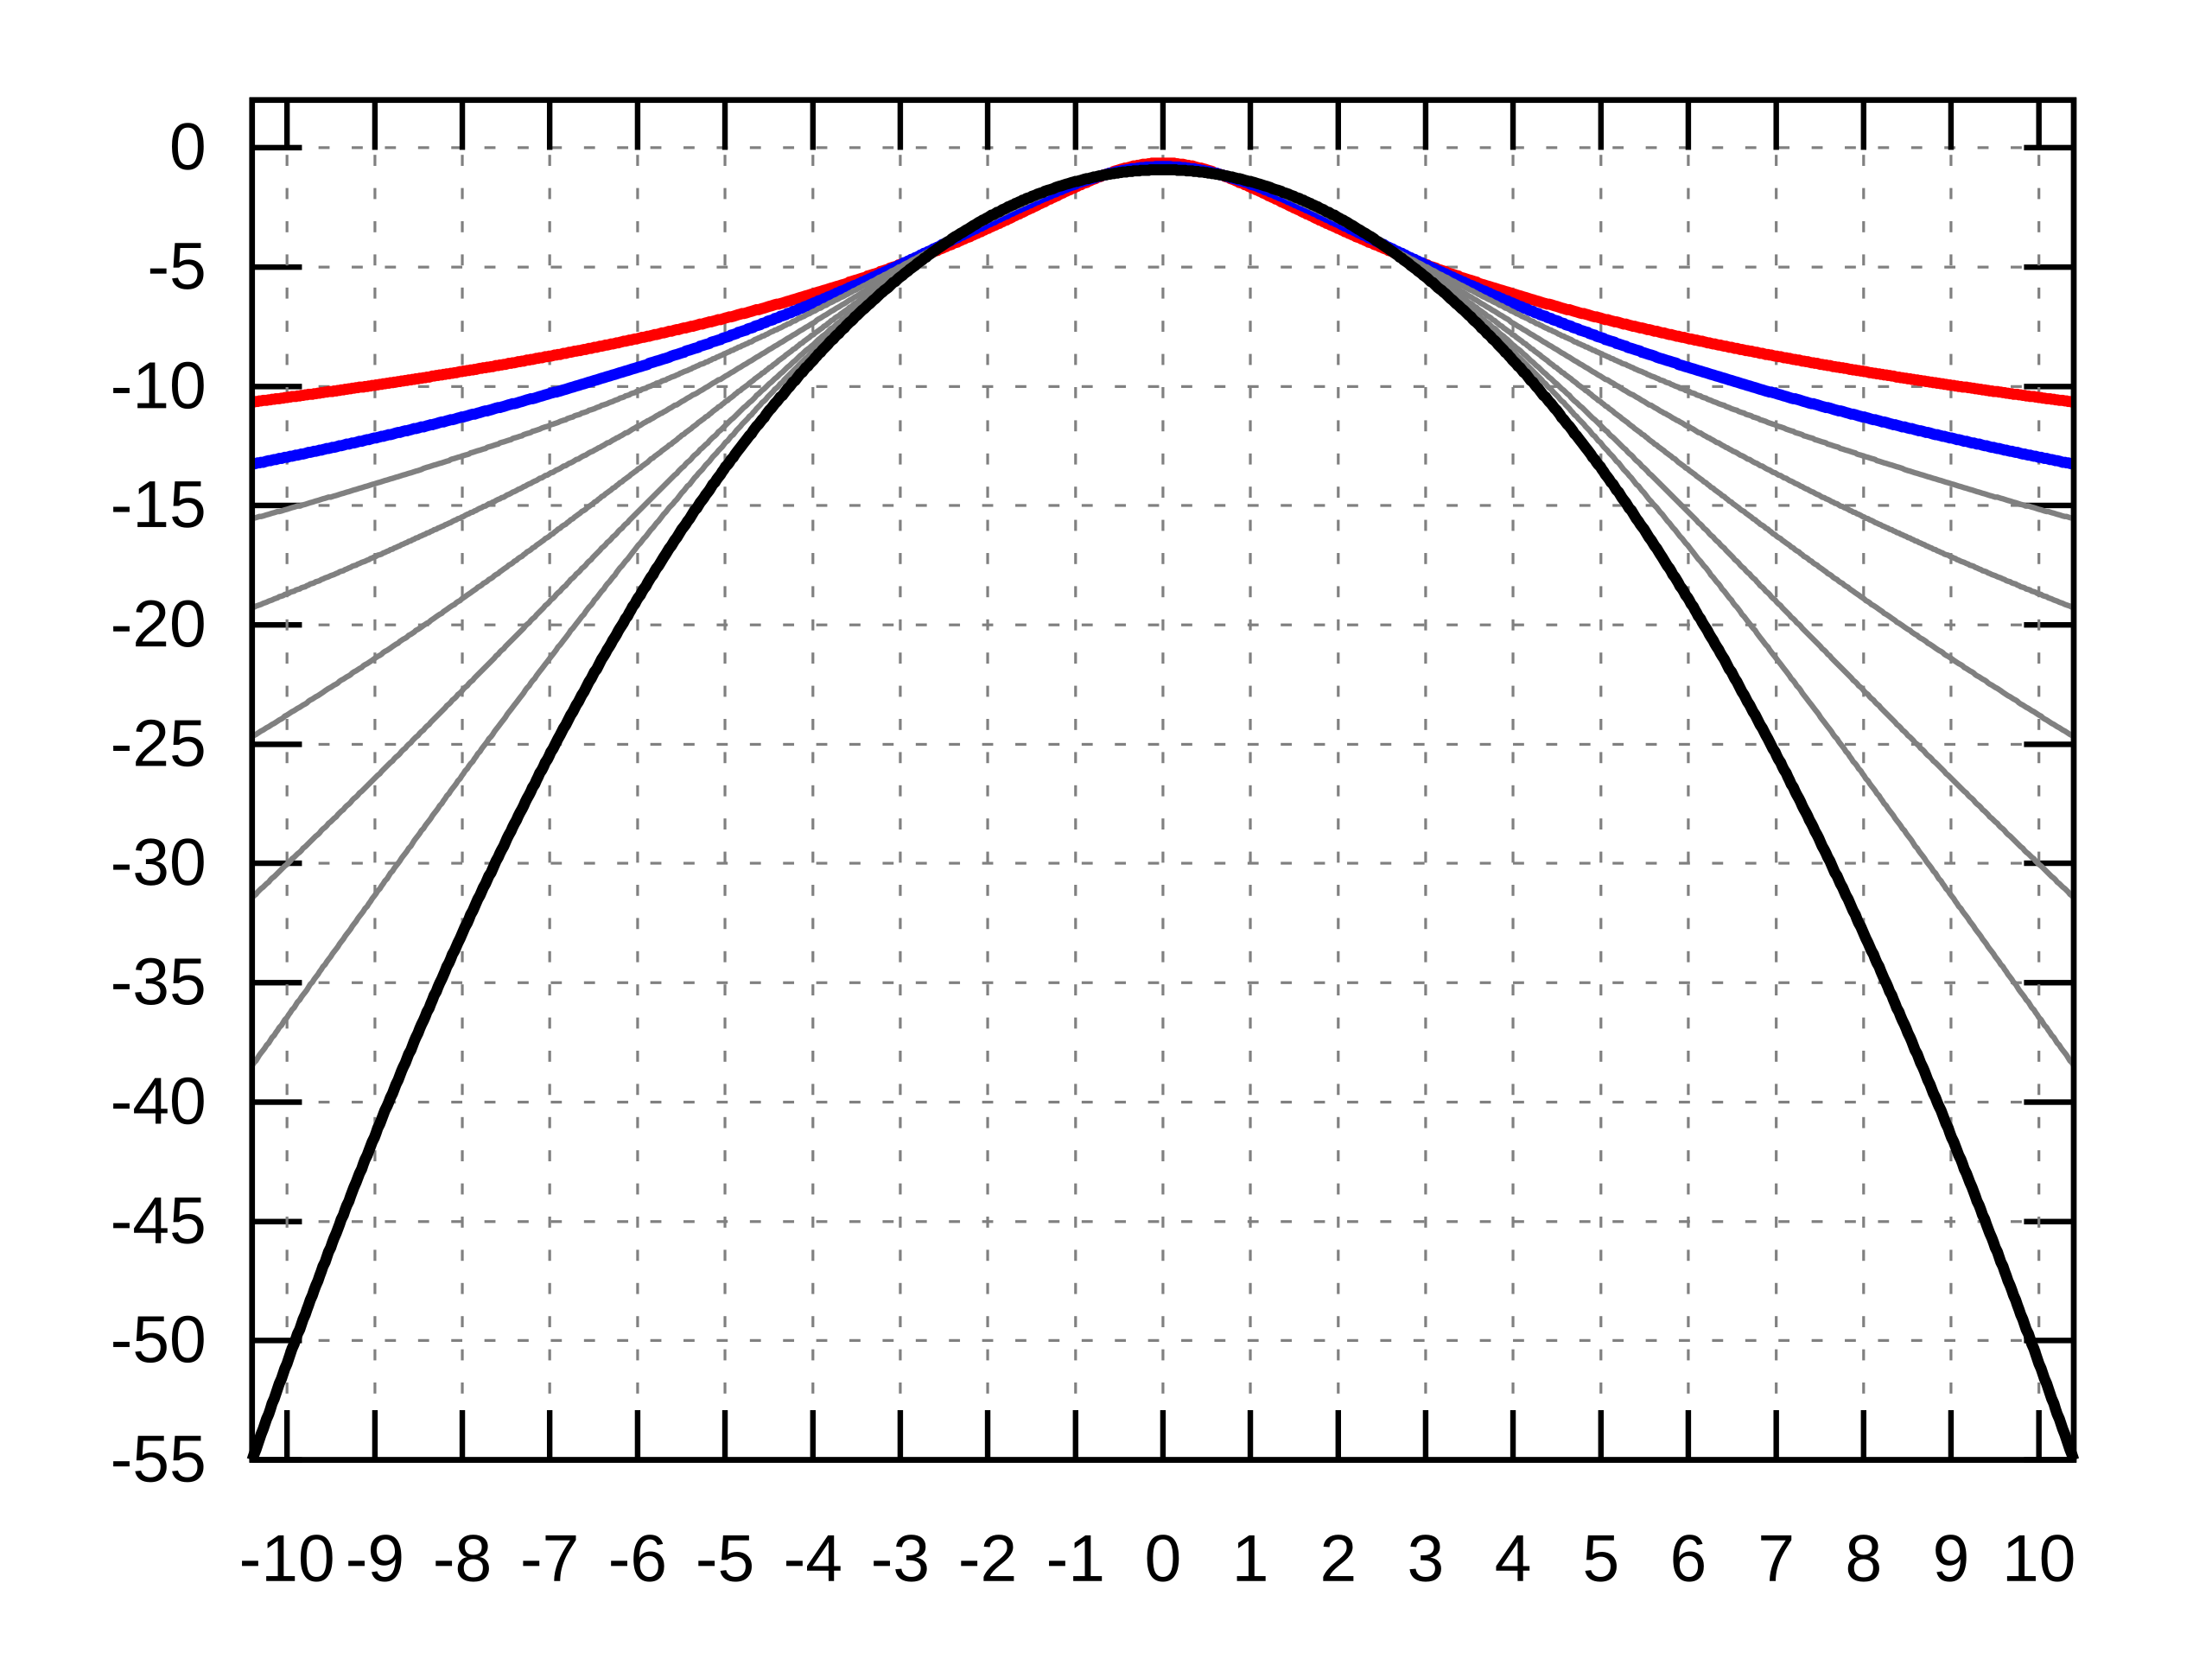
English: Natural logarithm of the probability density of the Pearson type VII distribution
The red curve shows the limiting density with infinite kurtosis; the blue curve shows the density with kurtosis equal to 2; the black curve shows the limiting (normal) density with zero kurtosis. The gray curves (between the blue and the black) show densities with kurtoses 1, 1/2, 1/4, 1/8, and 1/16. |
||||||
| Date | |||||||
| Source | MarkSweep | ||||||
| Author |
Vector: |
||||||
| Permission (Reusing this file) |
I, the copyright holder of this work, hereby publish it under the following license:
|
||||||
| Other versions |
File:Pearson_type_VII_distribution_PDF.svg File:Pearson_type_VII_distribution_PDF.png File:Pearson_type_VII_distribution_log-PDF.png |
||||||
| SVG development | |||||||
| Source code | Gnuplot code# the Pearson type VII log-pdf
log_p7(x,a2,m) = lgamma(m) - lgamma(m-0.5) - m*log(1+x*x/a2) - 0.5*log(a2*pi)
# the Pearson type VII log-pdf with unit variance and kurtosis k
f(x,k) = log_p7(x, 2+6.0/k, 2.5+3.0/k)
# the standard normal log-pdf (with unit variance and kurtosis 0)
n(x) = -0.5 * (x*x + log(2*pi))
# the limit of the Pearson type VII log-pdf for k -> infinity
g(x) = -2.5 * log(2 + x*x) + log(3)
set samples 1001
set grid
set xrange [-10.4:10.4]
set xtics 1
set yrange [-55:2]
set ytics 5
set terminal svg size 400,300 enhanced fname 'DejaVu Sans' fsize 10 butt solid
set output 'Pearson type VII distribution log-PDF.svg'
plot g(x) lt 1 lw 2 notitle, \
f(x,2) lt 3 lw 2 notitle, \
f(x,1) lt 9 lw 1 notitle, \
f(x,0.5) lt 9 lw 1 notitle, \
f(x,0.25) lt 9 lw 1 notitle, \
f(x,0.125) lt 9 lw 1 notitle, \
f(x,0.0625) lt 9 lw 1 notitle, \
n(x) lt 7 lw 2 notitle
|
File history
Click on a date/time to view the file as it appeared at that time.
| Date/Time | Thumbnail | Dimensions | User | Comment | |
|---|---|---|---|---|---|
| current | 18:30, 26 May 2020 | | 400 × 300 (132 KB) | Andel (talk | contribs) | == {{int:filedesc}} == {{Information |description=|Description= {{en|1=Natural logarithm of the probability density of the Pearson type VII distribution The red curve shows the limiting density with infinite kurtosis; the blue curve shows the density with kurtosis equal to 2; the black curve shows the limiting (normal) density with zero kurtosis. The gray curves (between the blue and the black) show densities with kurtoses 1, 1/2, 1/4, 1/8, and 1/16.}} |date= 2020-05-26 |source=[[User:MarkSw... |
You cannot overwrite this file.
File usage on Commons
The following page uses this file:
File usage on other wikis
The following other wikis use this file:
- Usage on en.wikipedia.org
- Usage on sv.wikipedia.org