File:PCE vs. CPI 1983 to 2021.png
Jump to navigation
Jump to search
Size of this preview: 800 × 308 pixels. Other resolutions: 320 × 123 pixels | 1,168 × 450 pixels.
Original file (1,168 × 450 pixels, file size: 88 KB, MIME type: image/png)
Captions
Captions
Add a one-line explanation of what this file represents
Summary
[edit]
| Description |
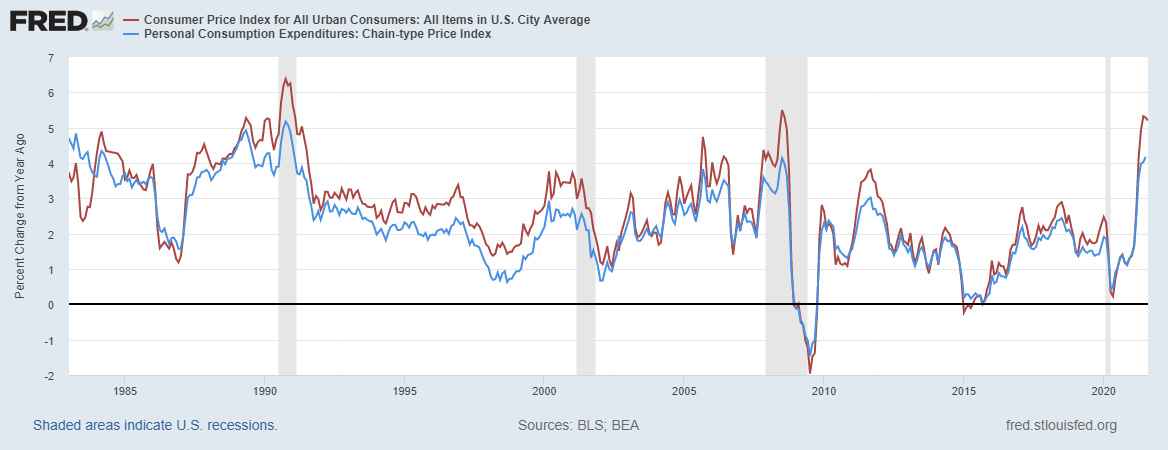
English: Percent annual change in Personal Consumption expenditures index (PCE) (blue) vs. CPI-U (red), January 1983 to January 2021 |
| Date | |
| Source | https://fred.stlouisfed.org/graph/?g=BJlP |
| Author | FRED, Federal Reserve Bank of St. Louis |
Licensing
[edit]
| This chart is ineligible for copyright and therefore in the public domain, because it consists entirely of information that is common property and contains no original authorship. For more information, see Commons:Threshold of originality § Charts
|
File history
Click on a date/time to view the file as it appeared at that time.
| Date/Time | Thumbnail | Dimensions | User | Comment | |
|---|---|---|---|---|---|
| current | 00:36, 19 September 2021 | 1,168 × 450 (88 KB) | MarginalCost (talk | contribs) | Update to August 2021 | |
| 04:45, 7 July 2021 | 1,168 × 450 (89 KB) | MarginalCost (talk | contribs) | Update to May 2021 | ||
| 21:43, 7 March 2021 | 1,168 × 450 (87 KB) | MarginalCost (talk | contribs) | Uploaded a work by FRED, Federal Reserve Bank of St. Louis from https://fred.stlouisfed.org/graph/?g=BJlP with UploadWizard |
You cannot overwrite this file.
File usage on Commons
There are no pages that use this file.