File:PCA of South Asian populations.png
Jump to navigation
Jump to search

Size of this preview: 800 × 597 pixels. Other resolutions: 320 × 239 pixels | 640 × 477 pixels | 1,024 × 764 pixels | 1,280 × 955 pixels | 1,420 × 1,059 pixels.
Original file (1,420 × 1,059 pixels, file size: 485 KB, MIME type: image/png)
Captions
Captions
Add a one-line explanation of what this file represents
Summary
[edit]| Description |
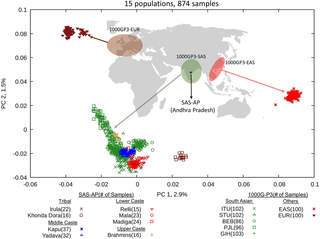
English: PCA of SAS-AP (South Asian-Andhra Pradesh) and 1000GP3 samples. Each symbol represents one individual. PC1 and PC2 are shown on the X and Y axis, respectively. The percentage of variance explained by each PC is labeled on the axis. The map shown in the figure is adapted from File:World_map_blank_without_borders.svg. |
| Date | Published: 2017-05-22 |
| Source | Rustagi, N., Zhou, A., Watkins, W.S. et al. Extremely low-coverage whole genome sequencing in South Asians captures population genomics information. BMC Genomics 18, 396 (2017) https://doi.org/10.1186/s12864-017-3767-6 |
| Author | Navin Rustagi, Anbo Zhou, W. Scott Watkins, Erika Gedvilaite, Shuoguo Wang, Naveen Ramesh, Donna Muzny, Richard A. Gibbs, Lynn B. Jorde, Fuli Yu & Jinchuan Xing |
| Other versions |
|


| ID | Group | Population |
|---|---|---|
| Brahmins | Upper caste | Brahmins |
| Kapu | Middle caste | Kapu |
| Yadava | Middle caste | Yadava |
| Mala | Lower caste | Mala |
| Madiga | Lower caste | Madiga |
| Relli | Lower caste | Relli |
| Irula | Tribal | Irula |
| Khonda Dora | Tribal | Khonda Dora |
| ITU | Indian Telugu in the U.K. | |
| STU | Sri Lankan Tamil in the UK | |
| BEB | Bengali in Bangladesh | |
| PJL | Punjabi in Lahore, Pakistan | |
| GIH | Gujarati Indians in Houston, Texas, United States | |
| EAS | East Asian | |
| EUR | European |
Licensing
[edit]
This file is licensed under the Creative Commons Attribution 4.0 International license.
- You are free:
- to share – to copy, distribute and transmit the work
- to remix – to adapt the work
- Under the following conditions:
- attribution – You must give appropriate credit, provide a link to the license, and indicate if changes were made. You may do so in any reasonable manner, but not in any way that suggests the licensor endorses you or your use.
File history
Click on a date/time to view the file as it appeared at that time.
| Date/Time | Thumbnail | Dimensions | User | Comment | |
|---|---|---|---|---|---|
| current | 16:44, 4 November 2019 | | 1,420 × 1,059 (485 KB) | Was a bee (talk | contribs) | {{Information |Description={{en|1=PCA of SAS-AP (South Asian-Andhra Pradesh) and 1000GP3 samples. Each symbol represents one individual. PC1 and PC2 are shown on the X and Y axis, respectively. The percentage of variance explained by each PC is labeled on the axis. The map shown in the figure is adapted from File:World_map_blank_without_borders.svg.}} |Source=Rustagi, N., Zhou, A., Watkins, W.S. et al. Extremely low-coverage whole genome sequencing in South Asians captures population gen... |
You cannot overwrite this file.
File usage on Commons
The following 3 pages use this file:
Categories:
- Principal component analysis of human genetic diversity
- Genetic studies on South Asian populations
- Genetic studies on Indian
- Genetic studies on Brahmins
- Genetic studies on Kapu
- Genetic studies on Yadava
- Genetic studies on Mala
- Genetic studies on Madiga
- Genetic studies on Reli
- Genetic studies on Irula
- Genetic studies on Khonda Dora
- Genetic studies on Telugu
- Genetic studies on Tamils
- Genetic studies on Bengalis
- Genetic studies on Punjabis
- Genetic studies on Gujaratis