File:P-V Curve diagram.jpg
Jump to navigation
Jump to search
Size of this preview: 800 × 581 pixels. Other resolutions: 320 × 232 pixels | 640 × 465 pixels | 1,024 × 743 pixels | 1,357 × 985 pixels.
Original file (1,357 × 985 pixels, file size: 83 KB, MIME type: image/jpeg)
Captions
Captions
Add a one-line explanation of what this file represents
Summary
[edit]
| Description |
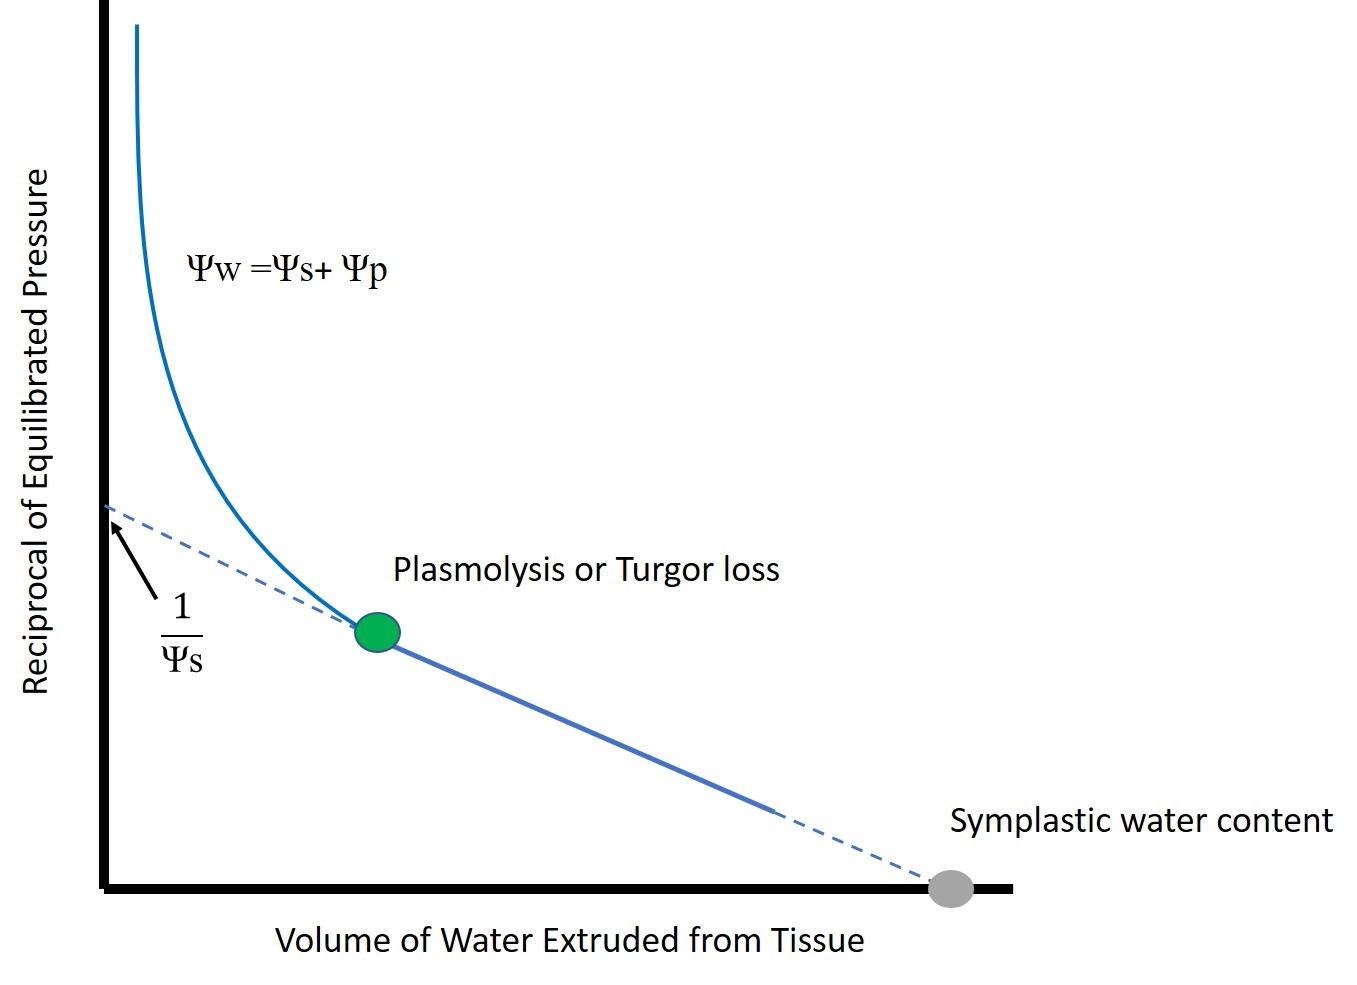
English: This is a simplified example of a pressure-volume curve on leaf tissue. The inflection point represents the loss of turgor or when the hydrostatic pressure will equal zero. The line that follows this inflection point only represents the solute potential, and if this line is extrapolated back to the y-axis the solute potential at full turgor can be approximated. |
| Date | |
| Source | Own work |
| Author | Brettfred |
Licensing
[edit]
I, the copyright holder of this work, hereby publish it under the following license:
This file is licensed under the Creative Commons Attribution-Share Alike 4.0 International license.
- You are free:
- to share – to copy, distribute and transmit the work
- to remix – to adapt the work
- Under the following conditions:
- attribution – You must give appropriate credit, provide a link to the license, and indicate if changes were made. You may do so in any reasonable manner, but not in any way that suggests the licensor endorses you or your use.
- share alike – If you remix, transform, or build upon the material, you must distribute your contributions under the same or compatible license as the original.
File history
Click on a date/time to view the file as it appeared at that time.
| Date/Time | Thumbnail | Dimensions | User | Comment | |
|---|---|---|---|---|---|
| current | 19:26, 29 November 2017 | | 1,357 × 985 (83 KB) | Brettfred (talk | contribs) | Cross-wiki upload from en.wikipedia.org |
You cannot overwrite this file.
File usage on Commons
There are no pages that use this file.
File usage on other wikis
The following other wikis use this file:
- Usage on en.wikipedia.org