File:Norvege Hubbert.svg

Original file (SVG file, nominally 512 × 387 pixels, file size: 24 KB)
Captions
Captions
Summary
[edit]| Description |
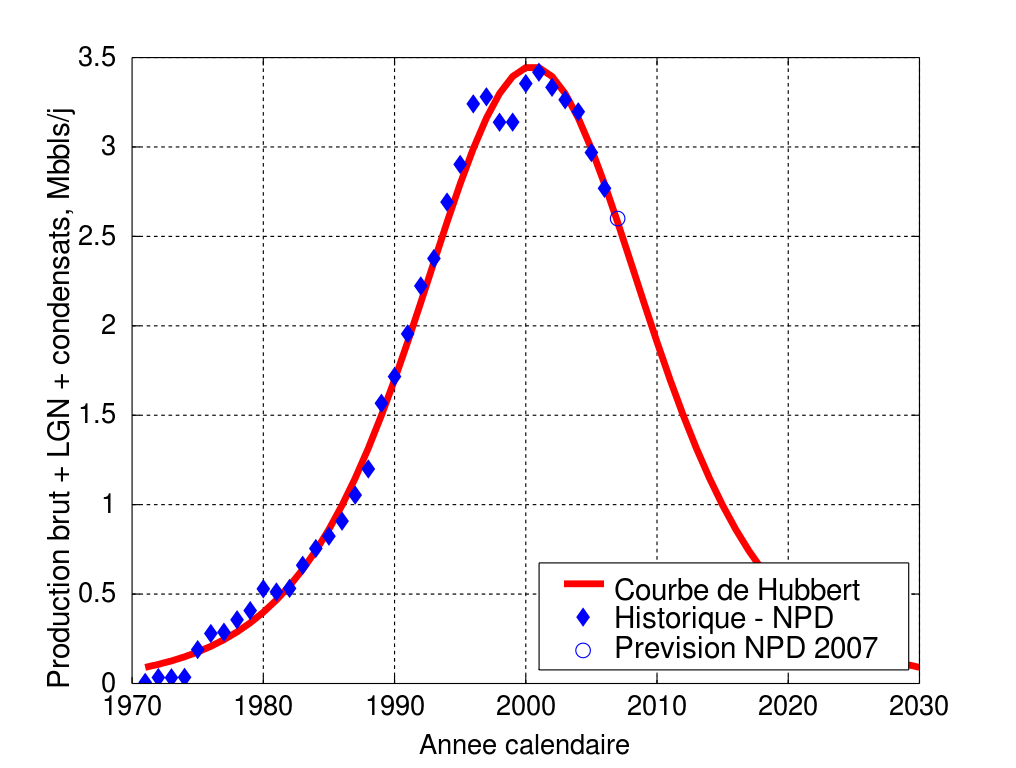
La théorie de Hubbert appliquée à la norvège. Graphique fait sous matlab et converti en SVG grace au très bon script de Juerg Schwizer [1]. Les chiffres de production historique sont ceux diffusés par le directoire du pétrole norvégien sur son site. Les trois colonnes "pétrole brut", "condensats" et "liquides de gaz naturel" sont additionnées et converties en barrils/jours utilisant 1 barril = 0.159 mètres cubes. La production pour 2006 est une moyenne sur 11 mois, le chiffre de décembre n'était pas encore disponible. La courbe rouge applique directement la formule de hubbert : Le modèle suit très bien les données historiques. Le modèle de hubbert fonctionne bien à certaines conditions : pas d'interruptions de production (dues par exemple à une guerre ou un changement de régime politique), pas de limitation par des quotas ou les infrastructures, disponibilité de capitaux pour les investissements, et la Norvège les remplit très bien. Le NPD a récemment (janvier 2007) diffusé une prévision à 2.6 millions de barrils/jours pour 2007, qui "tombe" presque exactement sur la courbe. A l'avenir, la production semble donc devoir continuer à diminuer. Il est intéressant de noter que la courbe de hubbert prévoit 9 milliards de barrils restant à produire, chiffre presque identique à la valeur de "réserves prouvées" donnée par le NPD. Cependant, si une zone pétrolière nouvelle est trouvée (par exemple autour des îles lofoten ou dans l'arctique), le production future sera supérieure, car ces nouvelles réserves n'entreront pas le cycle de hubbert décrit ici. |
| Date | 23 January 2007 (original upload date) |
| Source | No machine-readable source provided. Own work assumed (based on copyright claims). |
| Author | No machine-readable author provided. Raminagrobis assumed (based on copyright claims). |

Licensing
[edit]

|
Permission is granted to copy, distribute and/or modify this document under the terms of the GNU Free Documentation License, Version 1.2 or any later version published by the Free Software Foundation; with no Invariant Sections, no Front-Cover Texts, and no Back-Cover Texts. A copy of the license is included in the section entitled GNU Free Documentation License. |
| This file is licensed under the Creative Commons Attribution-Share Alike 3.0 Unported license. | ||
| ||
| This licensing tag was added to this file as part of the GFDL licensing update. |
- You are free:
- to share – to copy, distribute and transmit the work
- to remix – to adapt the work
- Under the following conditions:
- attribution – You must give appropriate credit, provide a link to the license, and indicate if changes were made. You may do so in any reasonable manner, but not in any way that suggests the licensor endorses you or your use.
File history
Click on a date/time to view the file as it appeared at that time.
| Date/Time | Thumbnail | Dimensions | User | Comment | |
|---|---|---|---|---|---|
| current | 20:13, 23 January 2007 | | 512 × 387 (24 KB) | Raminagrobis (talk | contribs) | La théorie de Hubbert appliquée à la norvège. Graphique fait sous matlab et converti en SVG grace au très bon script de Juerg Schwizer [http://www.mathworks.com/matlabcentral/fileexchange/loadFile.do?objectId=7401&objectType=FILE]. Les chiffres de |
You cannot overwrite this file.
File usage on Commons
There are no pages that use this file.
File usage on other wikis
The following other wikis use this file:
- Usage on fr.wikipedia.org