File:Normal distribution pdf.svg

Original file (SVG file, nominally 600 × 480 pixels, file size: 11 KB)
Captions
Captions
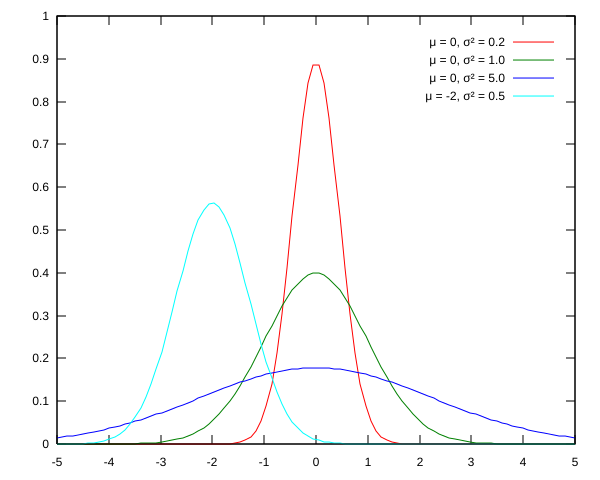
Probability density function for the normal distribution

|
Permission is granted to copy, distribute and/or modify this document under the terms of the GNU Free Documentation License, Version 1.2 or any later version published by the Free Software Foundation; with no Invariant Sections, no Front-Cover Texts, and no Back-Cover Texts. A copy of the license is included in the section entitled GNU Free Documentation License. |
| This file is licensed under the Creative Commons Attribution-Share Alike 3.0 Unported license. | ||
| ||
| This licensing tag was added to this file as part of the GFDL licensing update. |
gnuplot source under GPL; originally by MarkSweep:
_ln_dnorm(x, m, s) = -0.5 * log(2*pi) - log(s) - 0.5*((x-m)*1.0/s)**2
dnorm(x, mean, sd) = exp(_ln_dnorm(x, mean, sd))
pnorm(x, mean, sd) = norm((x-mean) * 1.0/sd)

set terminal svg
set output 'Normal distribution pdf.svg'

set xrange [-5:5]
set xtics 1
set yrange [0:1]
set ytics 0.1

f(x,y,z) = dnorm(x, y, sqrt(z)) #use variance, not sd!
set key 3.8,0.94

#f(x,y,z) = pnorm(x, y, sqrt(z))
#set key 3.8,0.2

plot \

    f(x,  0, 1)   title "μ =  0, σ² = 1.0", \
    f(x,  0, 5)   title "μ =  0, σ² = 5.0", \
    f(x, -2, 0.5) title "μ = -2, σ² = 0.5"
|
|
This work is free software; you can redistribute it and/or modify it under the terms of the GNU General Public License as published by the Free Software Foundation; either version 2 of the License, or any later version. This work is distributed in the hope that it will be useful, but without any warranty; without even the implied warranty of merchantability or fitness for a particular purpose. See version 2 and version 3 of the GNU General Public License for more details. |
File history
Click on a date/time to view the file as it appeared at that time.
| Date/Time | Thumbnail | Dimensions | User | Comment | |
|---|---|---|---|---|---|
| current | 06:49, 24 December 2006 | | 600 × 480 (11 KB) | Grendelkhan (talk | contribs) | Replace use of μ with μ |
| 06:46, 24 December 2006 |  | 600 × 480 (31 KB) | Grendelkhan (talk | contribs) | Probability density function for the normal distribution {{GFDL}} gnuplot source under GPL; originally by User:MarkSweep: _ln_dnorm(x, m, s) = -0.5 * log(2*pi) - log(s) - 0.5*((x-m)*1.0/s)**2 dnorm(x, mean, sd) = exp(_ln_dnorm(x, mean, sd)) pnorm |
You cannot overwrite this file.
File usage on Commons
The following page uses this file:
File usage on other wikis
The following other wikis use this file:
- Usage on en.wikipedia.org
- Usage on hu.wikipedia.org
- Usage on la.wikipedia.org
- Usage on nl.wikipedia.org
- Usage on pt.wikipedia.org
- Usage on tr.wikipedia.org
- Usage on uk.wikipedia.org
- Usage on vi.wikipedia.org
- Usage on zh.wikipedia.org