File:NaCl Concentration experiments. Obtained by gas discharge visualization method..jpg
NaCl_Concentration_experiments._Obtained_by_gas_discharge_visualization_method..jpg (457 × 404 pixels, file size: 18 KB, MIME type: image/jpeg)
Captions
Captions
Summary
[edit]
| Description |
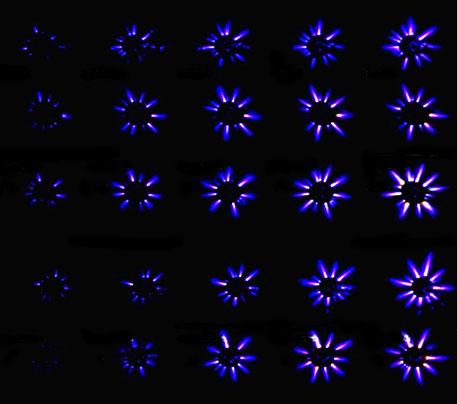
Українська: Зображення рідинно-фазного об'єкта отримані шляхом газорозрядної візуалізації при різних прикладених напругах до солі NaCl
Проведено серію експериментів по впливу концентрації солі NaCl на характер зображення. В експериментах прикладена напруга збільшувалась з кроком 500 В, при частоті 40 кГц, а концентрація солі NaCl збільшувалась з кроком 5 г/л. Перший експеримент був зі звичайною відстояною водою з водогону. Далі в цю воду додавалася сіль NaCl. По горизонталі – розкадрування з кроком 500 В, а по вертикалі – збільшення концентрації NaCl з кроком 5 г/л. Отримані результати показують, що за характером світіння рідинно-фазного об'єкта можна судити про його солоність (вміст домішки). Експерименти показали, що інтенсивність світіння стримерів збільшується при збільшенні концентрації NaCl. При великих концентраціях світіння було настільки інтенсивне, що сліпило сенсор камери. Встановлено, що при збільшенні концентрації NaCl інтенсивність випромінювання стримерів зростає, але стримери запалюються при більших напругах, що також можна використати для визначення концентрації NaCl. Довжина стримерів залежно від концентрації суттєво не змінилась.English: Images obtained by gas discharge visualization of liquid object at different voltages applied to the salt NaCl. A series of experiments maked for finding the effect of NaCl salt concentration on the character image. In the experiments, the applied voltage increased in steps of 500 V at a frequency of 40 kHz, and NaCl salt concentration increased in increments of 5 g / l. The first experiment was maked with normal pooled water from the water supply system of the town. Then the water was added to the salt NaCl. Horizontal - storyboard increments of 500 V, and vertically - increasing concentration of NaCl in increments of 5 g / l. The results show that the character of the liquid object glow can be judged on its salinity (impurity content). Experiments have shown that the intensity of glow tape streamers increases with increasing concentrations of NaCl. At high concentrations, the glow was so intense that camera cannot make photo. Determined that increasing concentrations of NaCl streamers radiation intensity increases, but the streamers are lit at higher voltages, which can also be used to determine the concentration of NaCl. Wave length of light of streamers depending on concentrations did not change significantly. |
| Date | |
| Source | Own work |
| Author | Ярослав Кулик Алатолійович, Павлюк Олександр Анатолійович |
| Camera location | | View this and other nearby images on: OpenStreetMap |
|---|
This image was obtained in Vinnitsa National Technical University for science research. Was used by Pavluk Oleksandr(in that time post-graduate student) for science work and publications.
Licensing
[edit]
- You are free:
- to share – to copy, distribute and transmit the work
- to remix – to adapt the work
- Under the following conditions:
- attribution – You must give appropriate credit, provide a link to the license, and indicate if changes were made. You may do so in any reasonable manner, but not in any way that suggests the licensor endorses you or your use.
- share alike – If you remix, transform, or build upon the material, you must distribute your contributions under the same or compatible license as the original.
| This image was uploaded as part of European Science Photo Competition 2015. |
File history
Click on a date/time to view the file as it appeared at that time.
| Date/Time | Thumbnail | Dimensions | User | Comment | |
|---|---|---|---|---|---|
| current | 19:11, 31 October 2015 | | 457 × 404 (18 KB) | Ярослав 89 (talk | contribs) | User created page with UploadWizard |
You cannot overwrite this file.
File usage on Commons
There are no pages that use this file.