File:NASA-GISTEMP-Hemispheres.svg
Jump to navigation
Jump to search

Size of this PNG preview of this SVG file: 725 × 480 pixels. Other resolutions: 320 × 212 pixels | 1,024 × 678 pixels | 1,280 × 847 pixels | 2,560 × 1,695 pixels.
Original file (SVG file, nominally 725 × 480 pixels, file size: 86 KB)
Captions
Captions
Add a one-line explanation of what this file represents
Summary
[edit]
| Description |
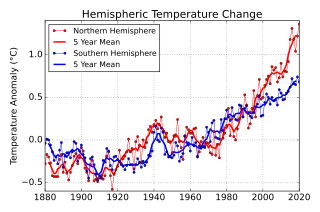
English: Graph showing the development of average temperatures from 1880 till 2023 for each hemisphere separately. Data from https://data.giss.nasa.gov/gistemp/graphs/. This plot may and should be updated using the code below, whenever new data points become available. |
| Date | |
| Source | Own work |
| Author | Geek3 |
| SVG development | This plot was created with Matplotlib. |
| Source code | Python code#! /usr/bin/env python3
# -*- coding:utf8 -*-
import matplotlib.pyplot as plt
import numpy as np
from math import *
plt.style.use('classic')
years = range(1880, 2023+1)
northern = [
-.28, -.17, -.20, -.27, -.42, -.43, -.43, -.43, -.23, -.17, # 188x
-.38, -.26, -.39, -.47, -.38, -.30, -.19, -.16, -.28, -.21, # 189x
-.09, -.13, -.33, -.38, -.48, -.29, -.24, -.48, -.46, -.49, # 190x
-.44, -.42, -.46, -.42, -.19, -.14, -.42, -.58, -.40, -.35, # 191x
-.31, -.12, -.28, -.22, -.19, -.14, .01, -.14, -.10, -.34, # 192x
-.02, .04, -.06, -.26, .00, -.09, -.03, .12, .16, .09, # 193x
.18, .23, .13, .18, .27, .10, .03, .08, -.02, -.03, # 194x
-.15, .05, .06, .24, -.02, -.09, -.23, .04, .15, .12, # 195x
.08, .08, .13, .14, -.19, -.14, -.02, .03, -.07, -.03, # 196x
-.04, -.15, -.17, .10, -.18, -.05, -.21, .12, .02, .08, # 197x
.17, .37, .05, .25, .04, -.00, .13, .25, .37, .27, # 198x
.53, .41, .14, .19, .37, .58, .27, .52, .71, .48, # 199x
.50, .64, .71, .75, .66, .86, .82, .85, .68, .73, # 200x
.90, .74, .81, .80, .92, 1.18, 1.31, 1.18, 1.03, 1.21, # 201x
1.35, 1.14, 1.16, 1.50] # 202x
southern = [
-.04, .01, .00, -.06, -.14, -.24, -.20, -.28, -.12, -.03, # 188x
-.32, -.19, -.15, -.15, -.21, -.14, -.02, -.04, -.25, -.13, # 189x
-.06, -.17, -.21, -.36, -.45, -.22, -.20, -.29, -.40, -.47, # 190x
-.42, -.45, -.24, -.26, -.10, -.13, -.30, -.35, -.20, -.19, # 191x
-.23, -.25, -.29, -.31, -.35, -.30, -.22, -.29, -.29, -.38, # 192x
-.29, -.22, -.26, -.32, -.25, -.30, -.26, -.18, -.19, -.13, # 193x
.09, .16, .00, -.02, .14, .09, -.17, -.14, -.20, -.20, # 194x
-.21, -.18, -.03, -.07, -.25, -.20, -.16, .05, -.03, -.06, # 195x
-.13, .03, -.06, -.03, -.20, -.07, -.09, -.08, -.09, .15, # 196x
.09, -.02, .20, .23, .03, .02, .01, .24, .11, .25, # 197x
.35, .27, .23, .38, .28, .24, .23, .41, .40, .27, # 198x
.37, .40, .31, .28, .26, .32, .39, .42, .52, .28, # 199x
.29, .44, .54, .50, .42, .50, .46, .47, .41, .59, # 200x
.55, .47, .48, .55, .57, .62, .72, .66, .66, .74, # 201x
.68, .55, .62, .85] # 202x
n_avg = 5
northern_avg = np.convolve(northern, np.ones((n_avg,))/n_avg, mode='valid')
southern_avg = np.convolve(southern, np.ones((n_avg,))/n_avg, mode='valid')
plt.rc('font', size=15)
fig = plt.figure(figsize=(680 / 90.0, 450 / 90.0), dpi=72)
plt.plot(years, northern, 'ro-', linewidth=0.7, markersize=4, label='Northern Hemisphere')
plt.plot(years[n_avg//2:-(n_avg//2)], northern_avg, 'r-', lw=2.5, zorder=-1, label='5 Year Mean')
plt.plot(years, southern, 'bo-', linewidth=0.7, markersize=4, label='Southern Hemisphere')
plt.plot(years[n_avg//2:-(n_avg//2)], southern_avg, 'b-', lw=2.5, zorder=-1, label='5 Year Mean')
plt.grid(True)
plt.xlim(floor(min(years)/5.)*5., ceil(max(years)/5.)*5.)
plt.ylim(-0.6, 1.52)
plt.ylabel(u'Temperature Anomaly (\u00B0C)')
plt.title('Hemispheric Temperature Change')
plt.legend(loc='upper left', prop={'size':13})
plt.tight_layout()
plt.savefig('NASA-GISTEMP-Hemispheres.svg')
|

|
This file may be updated to reflect new information. If you wish to use a specific version of the file without it being overwritten, please upload the required version as a separate file. |
Licensing
[edit]
I, the copyright holder of this work, hereby publish it under the following license:
This file is licensed under the Creative Commons Attribution-Share Alike 4.0 International license.
- You are free:
- to share – to copy, distribute and transmit the work
- to remix – to adapt the work
- Under the following conditions:
- attribution – You must give appropriate credit, provide a link to the license, and indicate if changes were made. You may do so in any reasonable manner, but not in any way that suggests the licensor endorses you or your use.
- share alike – If you remix, transform, or build upon the material, you must distribute your contributions under the same or compatible license as the original.
Any autoconfirmed user can overwrite this file from the same source. Please ensure that overwrites comply with the guideline.
File history
Click on a date/time to view the file as it appeared at that time.
| Date/Time | Thumbnail | Dimensions | User | Comment | |
|---|---|---|---|---|---|
| current | 10:31, 24 August 2024 | | 725 × 480 (86 KB) | Geek3 (talk | contribs) | update 2023 |
| 13:56, 3 August 2021 |  | 680 × 450 (82 KB) | Geek3 (talk | contribs) | update 2020 | |
| 13:01, 18 February 2019 |  | 680 × 450 (92 KB) | Geek3 (talk | contribs) | added 2018 values | |
| 23:09, 27 March 2018 |  | 680 × 450 (94 KB) | Geek3 (talk | contribs) | User created page with UploadWizard |
You cannot overwrite this file.
File usage on Commons
The following page uses this file:
File usage on other wikis
The following other wikis use this file:
- Usage on de.wikipedia.org