File:Molybdenum specimen chart.jpg
Jump to navigation
Jump to search
No higher resolution available.
Molybdenum_specimen_chart.jpg (315 × 415 pixels, file size: 25 KB, MIME type: image/jpeg)
Captions
Captions
Add a one-line explanation of what this file represents
Summary
[edit]| Description |
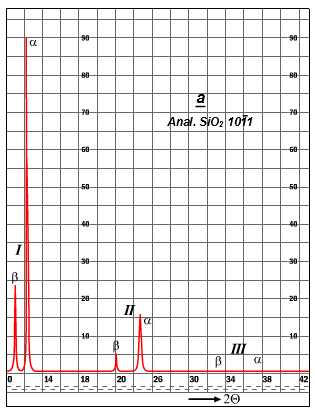
English: A chart for a scan of a Molybdenum specimen. The tall peak on the left side is the characteristic alpha line at a two theta of 12 degrees. Second and third order lines also appear.
Русский: Рентгеновский характеристический спектр молибдена полученный на современном оборудовании. Кристалл-анализатор - кварц, анализирующая кристаллографическая плоскость Цифрами I, II, III отмечены дифракционные спектры 1-го, 2-го и 3-го порядков. |
| Date | created 6/24/2011 / unpublished |
| Source | original: based on X-ray Spectroscopy output data |
| Author | Charles Miller |
| Other versions |
|


|
File:Molybdenum specimen chart-int.svg is a vector version of this file. It should be used in place of this JPG file when not inferior.
File:Molybdenum specimen chart.jpg → File:Molybdenum specimen chart-int.svg
For more information, see Help:SVG. |
 |
Licensing
[edit]
| I, the copyright holder of this work, release this work into the public domain. This applies worldwide. In some countries this may not be legally possible; if so: I grant anyone the right to use this work for any purpose, without any conditions, unless such conditions are required by law. |
File history
Click on a date/time to view the file as it appeared at that time.
| Date/Time | Thumbnail | Dimensions | User | Comment | |
|---|---|---|---|---|---|
| current | 14:36, 3 July 2011 | | 315 × 415 (25 KB) | David Miller 18 (talk | contribs) | {{Information |Description ={{en|1=A chart for a scan of a Molybdenum specimen. The tall peak on the left side is the characteristic alpha line at a two theta of 12 degrees. Second and third order lines also appear.}} |Source =original: based o |
You cannot overwrite this file.
File usage on Commons
The following 2 pages use this file:
File usage on other wikis
The following other wikis use this file:
- Usage on ca.wikipedia.org
- Usage on en.wikipedia.org
- Usage on fr.wikipedia.org
- Usage on hr.wikipedia.org