File:Mental health workers in OECD.svg
Jump to navigation
Jump to search

Size of this PNG preview of this SVG file: 800 × 400 pixels. Other resolutions: 320 × 160 pixels | 640 × 320 pixels | 1,024 × 512 pixels | 1,280 × 640 pixels | 2,560 × 1,280 pixels | 1,440 × 720 pixels.
Original file (SVG file, nominally 1,440 × 720 pixels, file size: 128 KB)
Captions
Captions
Add a one-line explanation of what this file represents

|
This file may be updated to reflect new information. If you wish to use a specific version of the file without it being overwritten, please upload the required version as a separate file. |
Summary
[edit]
| Description |
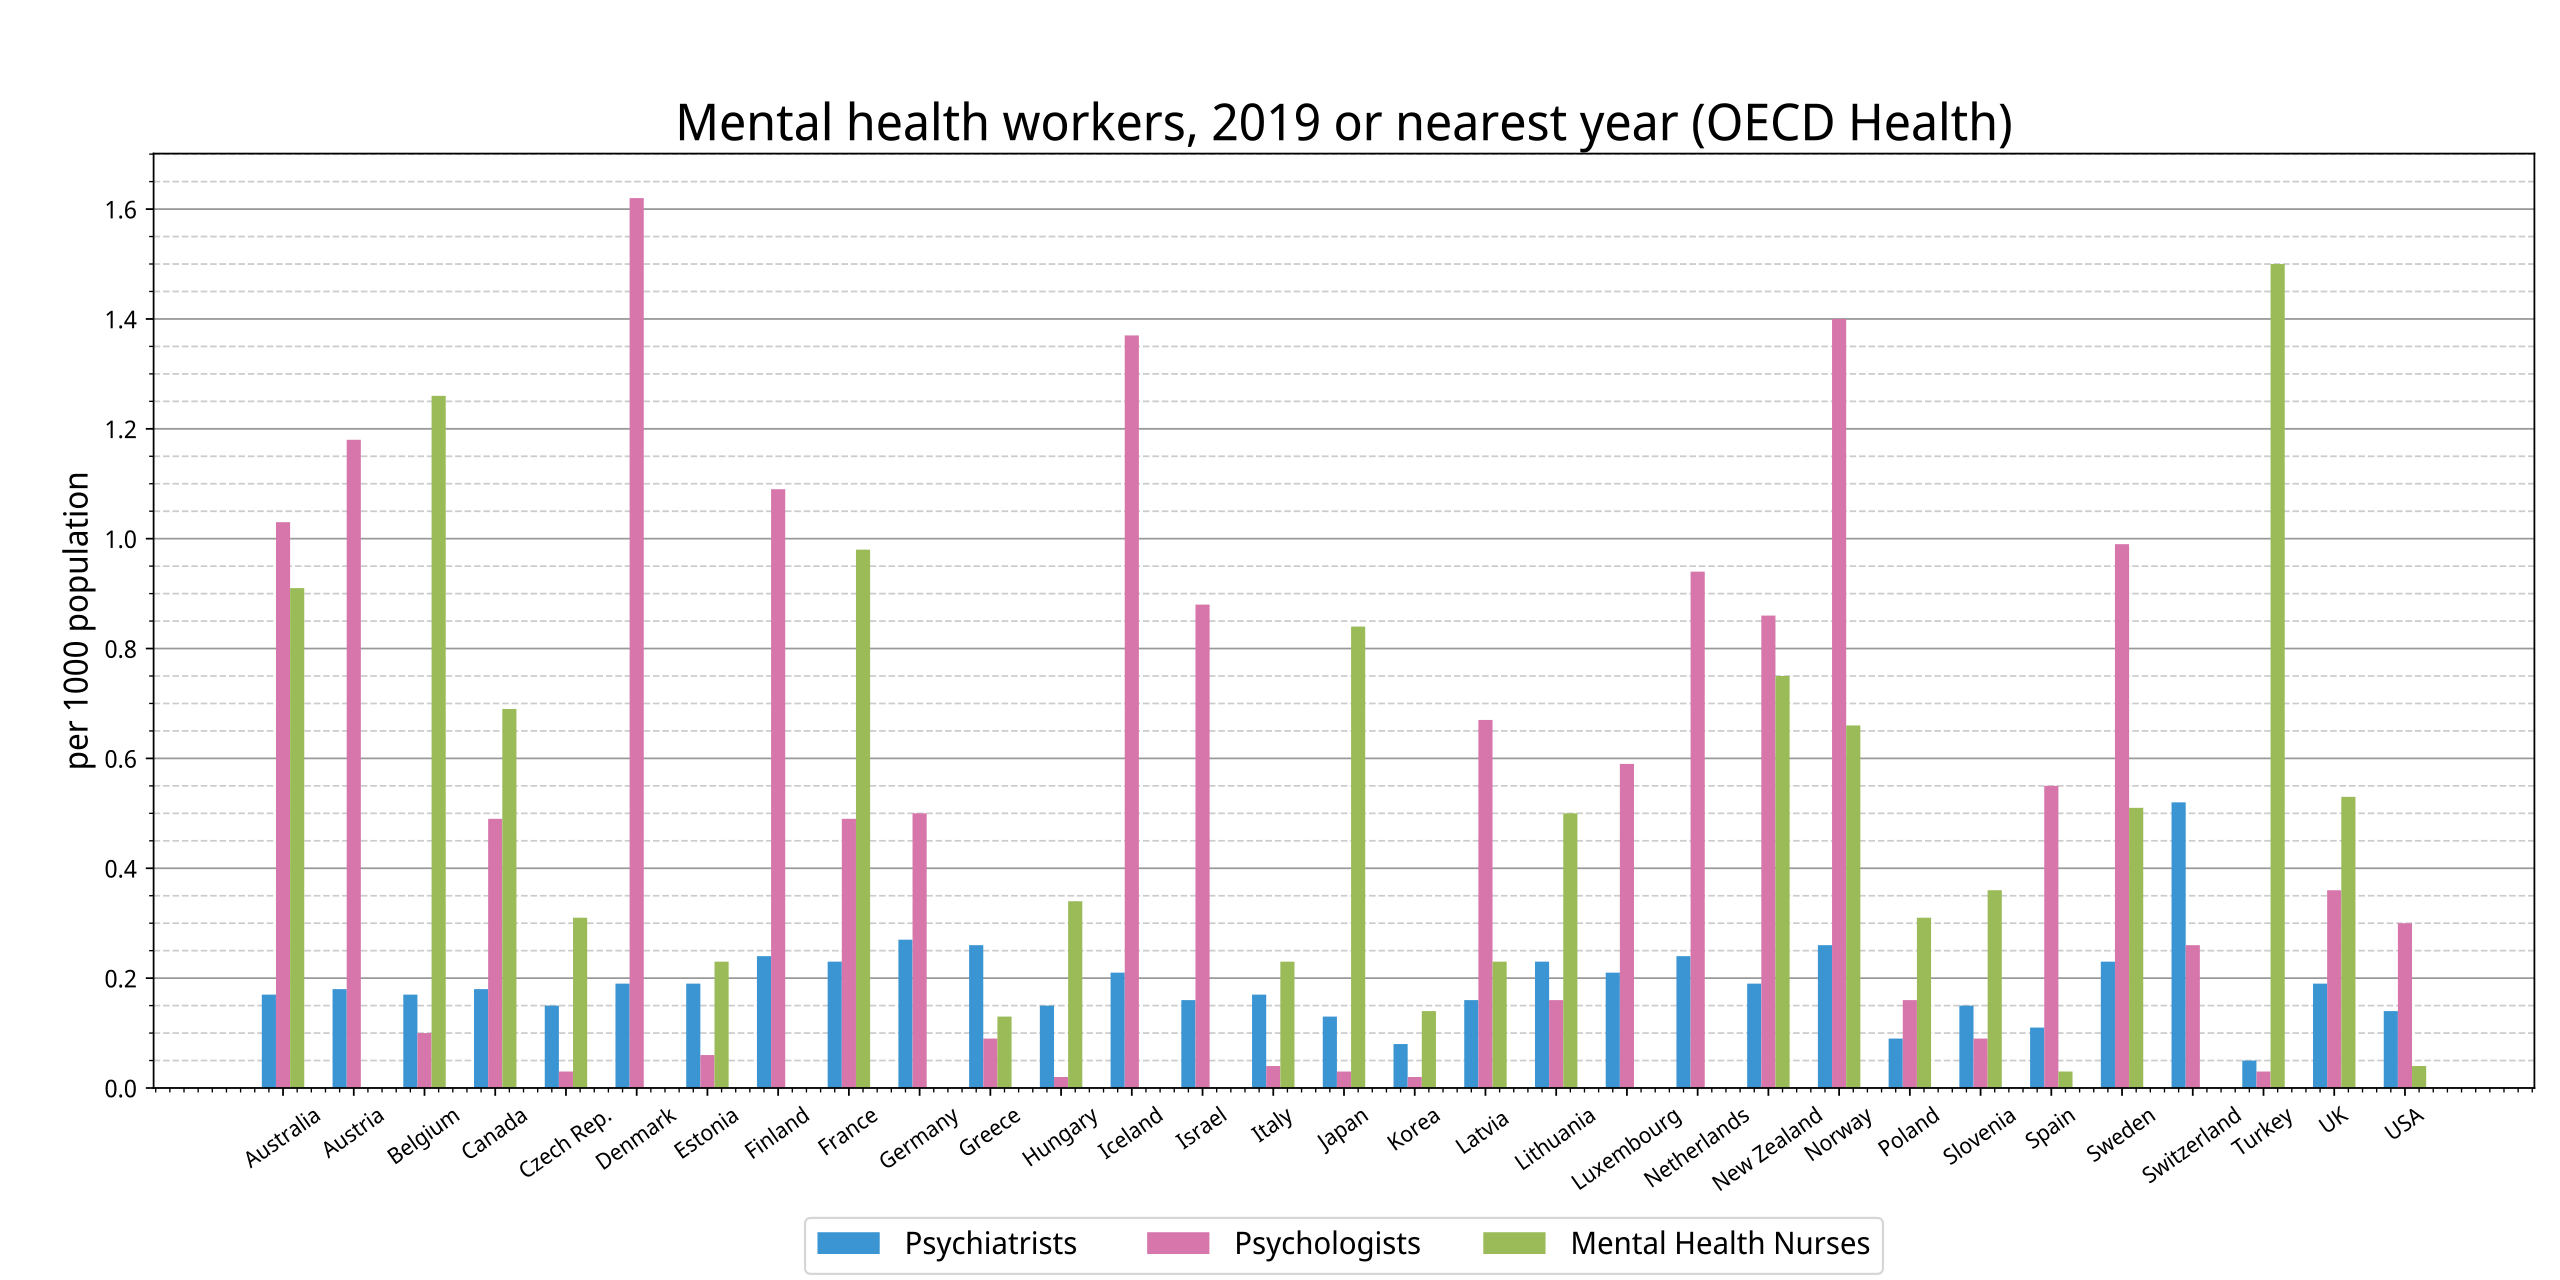
English: Mental Health workers per 100,000 population, 2019(or nearest) |
| Date | |
| Source |
Own work , Data from OECD A New Benchmark for Mental Health Systems: Tackling the Social and Economic Costs of Mental Ill-Health https://doi.org/10.1787/4ed890f6-en. |
| Author | Yuasan |
| Permission (Reusing this file) |
CC-0 |
Licensing
[edit]
I, the copyright holder of this work, hereby publish it under the following license:
| This file is made available under the Creative Commons CC0 1.0 Universal Public Domain Dedication. | |
| The person who associated a work with this deed has dedicated the work to the public domain by waiving all of their rights to the work worldwide under copyright law, including all related and neighboring rights, to the extent allowed by law. You can copy, modify, distribute and perform the work, even for commercial purposes, all without asking permission.
|
Graph Data
[edit]
import matplotlib.pyplot as plt
import pandas as pd
import numpy as np

df = pd.read_csv("data.tsv", index_col=0 , sep = "\t")

fig, ax = plt.subplots(figsize=(16, 8))
x = np.arange(df.index.size)
ax.bar(x-0.2, df["Psychiatrists "] , color="#3b95d3", width=0.2, bottom=0)
ax.bar(x, df["Psychologists"] , color="#D676AB", width=0.2, bottom=0)
ax.bar(x+0.2, df["Mental Health Nurses"] , color="#9BBB59", width=0.2, bottom=0)

ax.legend(df.columns, fontsize=14, ncol=3, loc='center' ,bbox_to_anchor=(0, -0.22, 1., .102) )

ax.set_axisbelow(True)

plt.rcParams['font.family'] = 'sans-serif'
plt.rcParams['font.sans-serif'] = ['Noto Sans Display']
plt.subplots_adjust(left=0.06, bottom=0.15, right=0.99, top=0.9)

plt.title("Mental health workers, 2019 or nearest year (OECD Health)", fontsize=23)
plt.tick_params(labelsize=10, pad=4)
plt.xticks(x, df.index, rotation=35, size=10)

plt.ylabel("per 1000 population", size=15)
plt.yticks(fontsize=11)

ax.minorticks_on()
plt.grid(which='major',color='#999999',linestyle='-', axis="y")
plt.grid(which='minor',color='#cccccc',linestyle='--', axis="y")
plt.subplots_adjust(top =0.88)

plt.savefig("image.svg")
Any autoconfirmed user can overwrite this file from the same source. Please ensure that overwrites comply with the guideline.
File history
Click on a date/time to view the file as it appeared at that time.
| Date/Time | Thumbnail | Dimensions | User | Comment | |
|---|---|---|---|---|---|
| current | 12:51, 12 December 2022 | | 1,440 × 720 (128 KB) | Yuasan (talk | contribs) | 2019 data |
| 04:29, 16 February 2015 |  | 743 × 401 (79 KB) | Yuasan (talk | contribs) | User created page with UploadWizard |
You cannot overwrite this file.
File usage on Commons
The following page uses this file:
- File:Oecd-mentalhealth-workers.svg (file redirect)