File:Map of US states by average annual growth of median household income, 2010-2019.svg
Jump to navigation
Jump to search

Size of this PNG preview of this SVG file: 512 × 322 pixels. Other resolutions: 320 × 201 pixels | 640 × 403 pixels | 1,024 × 644 pixels | 1,280 × 805 pixels | 2,560 × 1,610 pixels.
Original file (SVG file, nominally 512 × 322 pixels, file size: 587 KB)
Captions
Captions
Add a one-line explanation of what this file represents
Summary
[edit]
| Description |
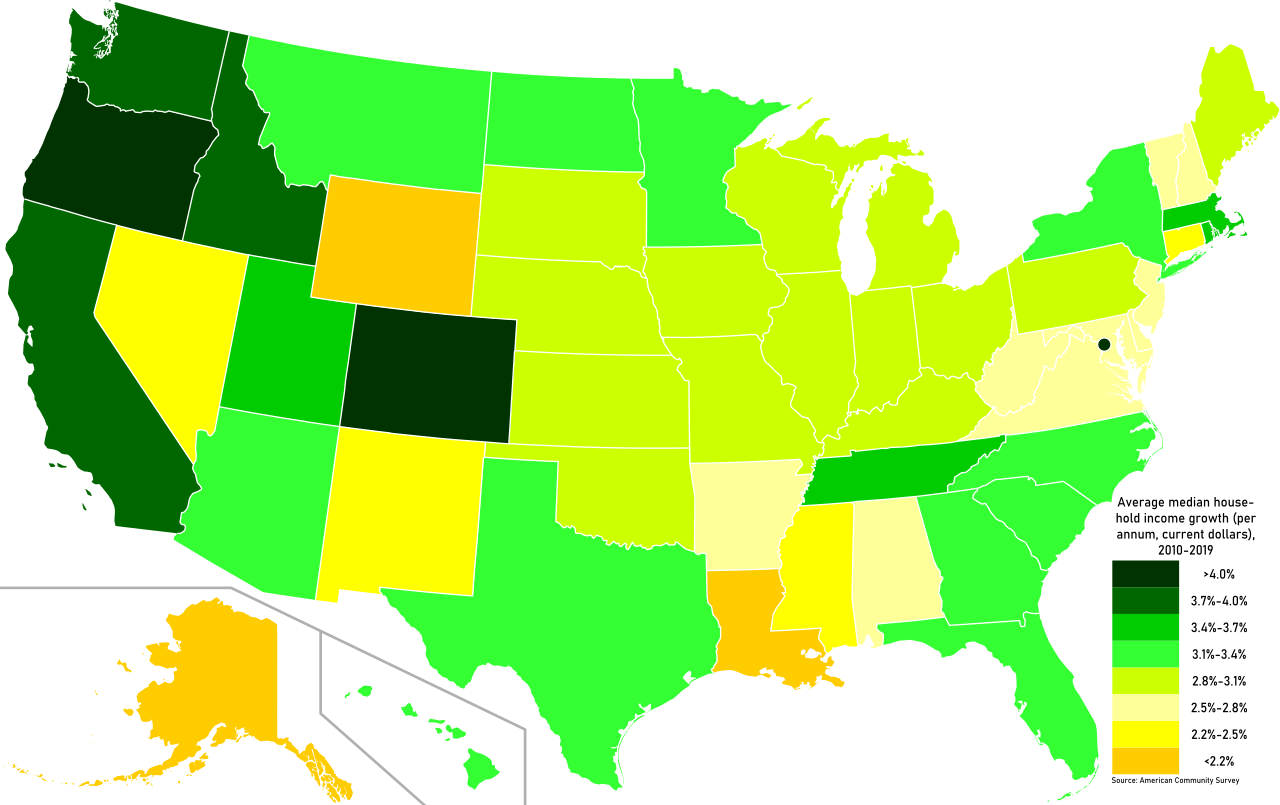
English: As seen on the image. Source: S1901 tables of the American Community Survey (2010-2019), given in current dollars. Used _2.svg) as basis. as basis. |
| Date | |
| Source | Own work |
| Author | Szmenderowiecki |
Licensing
[edit]
I, the copyright holder of this work, hereby publish it under the following license:
This file is licensed under the Creative Commons Attribution-Share Alike 4.0 International license.
- You are free:
- to share – to copy, distribute and transmit the work
- to remix – to adapt the work
- Under the following conditions:
- attribution – You must give appropriate credit, provide a link to the license, and indicate if changes were made. You may do so in any reasonable manner, but not in any way that suggests the licensor endorses you or your use.
- share alike – If you remix, transform, or build upon the material, you must distribute your contributions under the same or compatible license as the original.
File history
Click on a date/time to view the file as it appeared at that time.
| Date/Time | Thumbnail | Dimensions | User | Comment | |
|---|---|---|---|---|---|
| current | 22:03, 7 February 2022 | | 512 × 322 (587 KB) | Szmenderowiecki (talk | contribs) | Uploaded own work with UploadWizard |
You cannot overwrite this file.
File usage on Commons
There are no pages that use this file.
File usage on other wikis
The following other wikis use this file:
- Usage on en.wikipedia.org
- Usage on fa.wikipedia.org