File:Map of Titan - April 2011.jpg
Original file (4,374 × 2,430 pixels, file size: 2.25 MB, MIME type: image/jpeg)
Captions
Captions
Summary
[edit]

|
This file has been superseded by PIA19658-SaturnMoon-TitanGlobalMap-June2015.jpg. It is recommended to use the other file. Please note that deleting superseded images requires consent.
|

|
| Description |
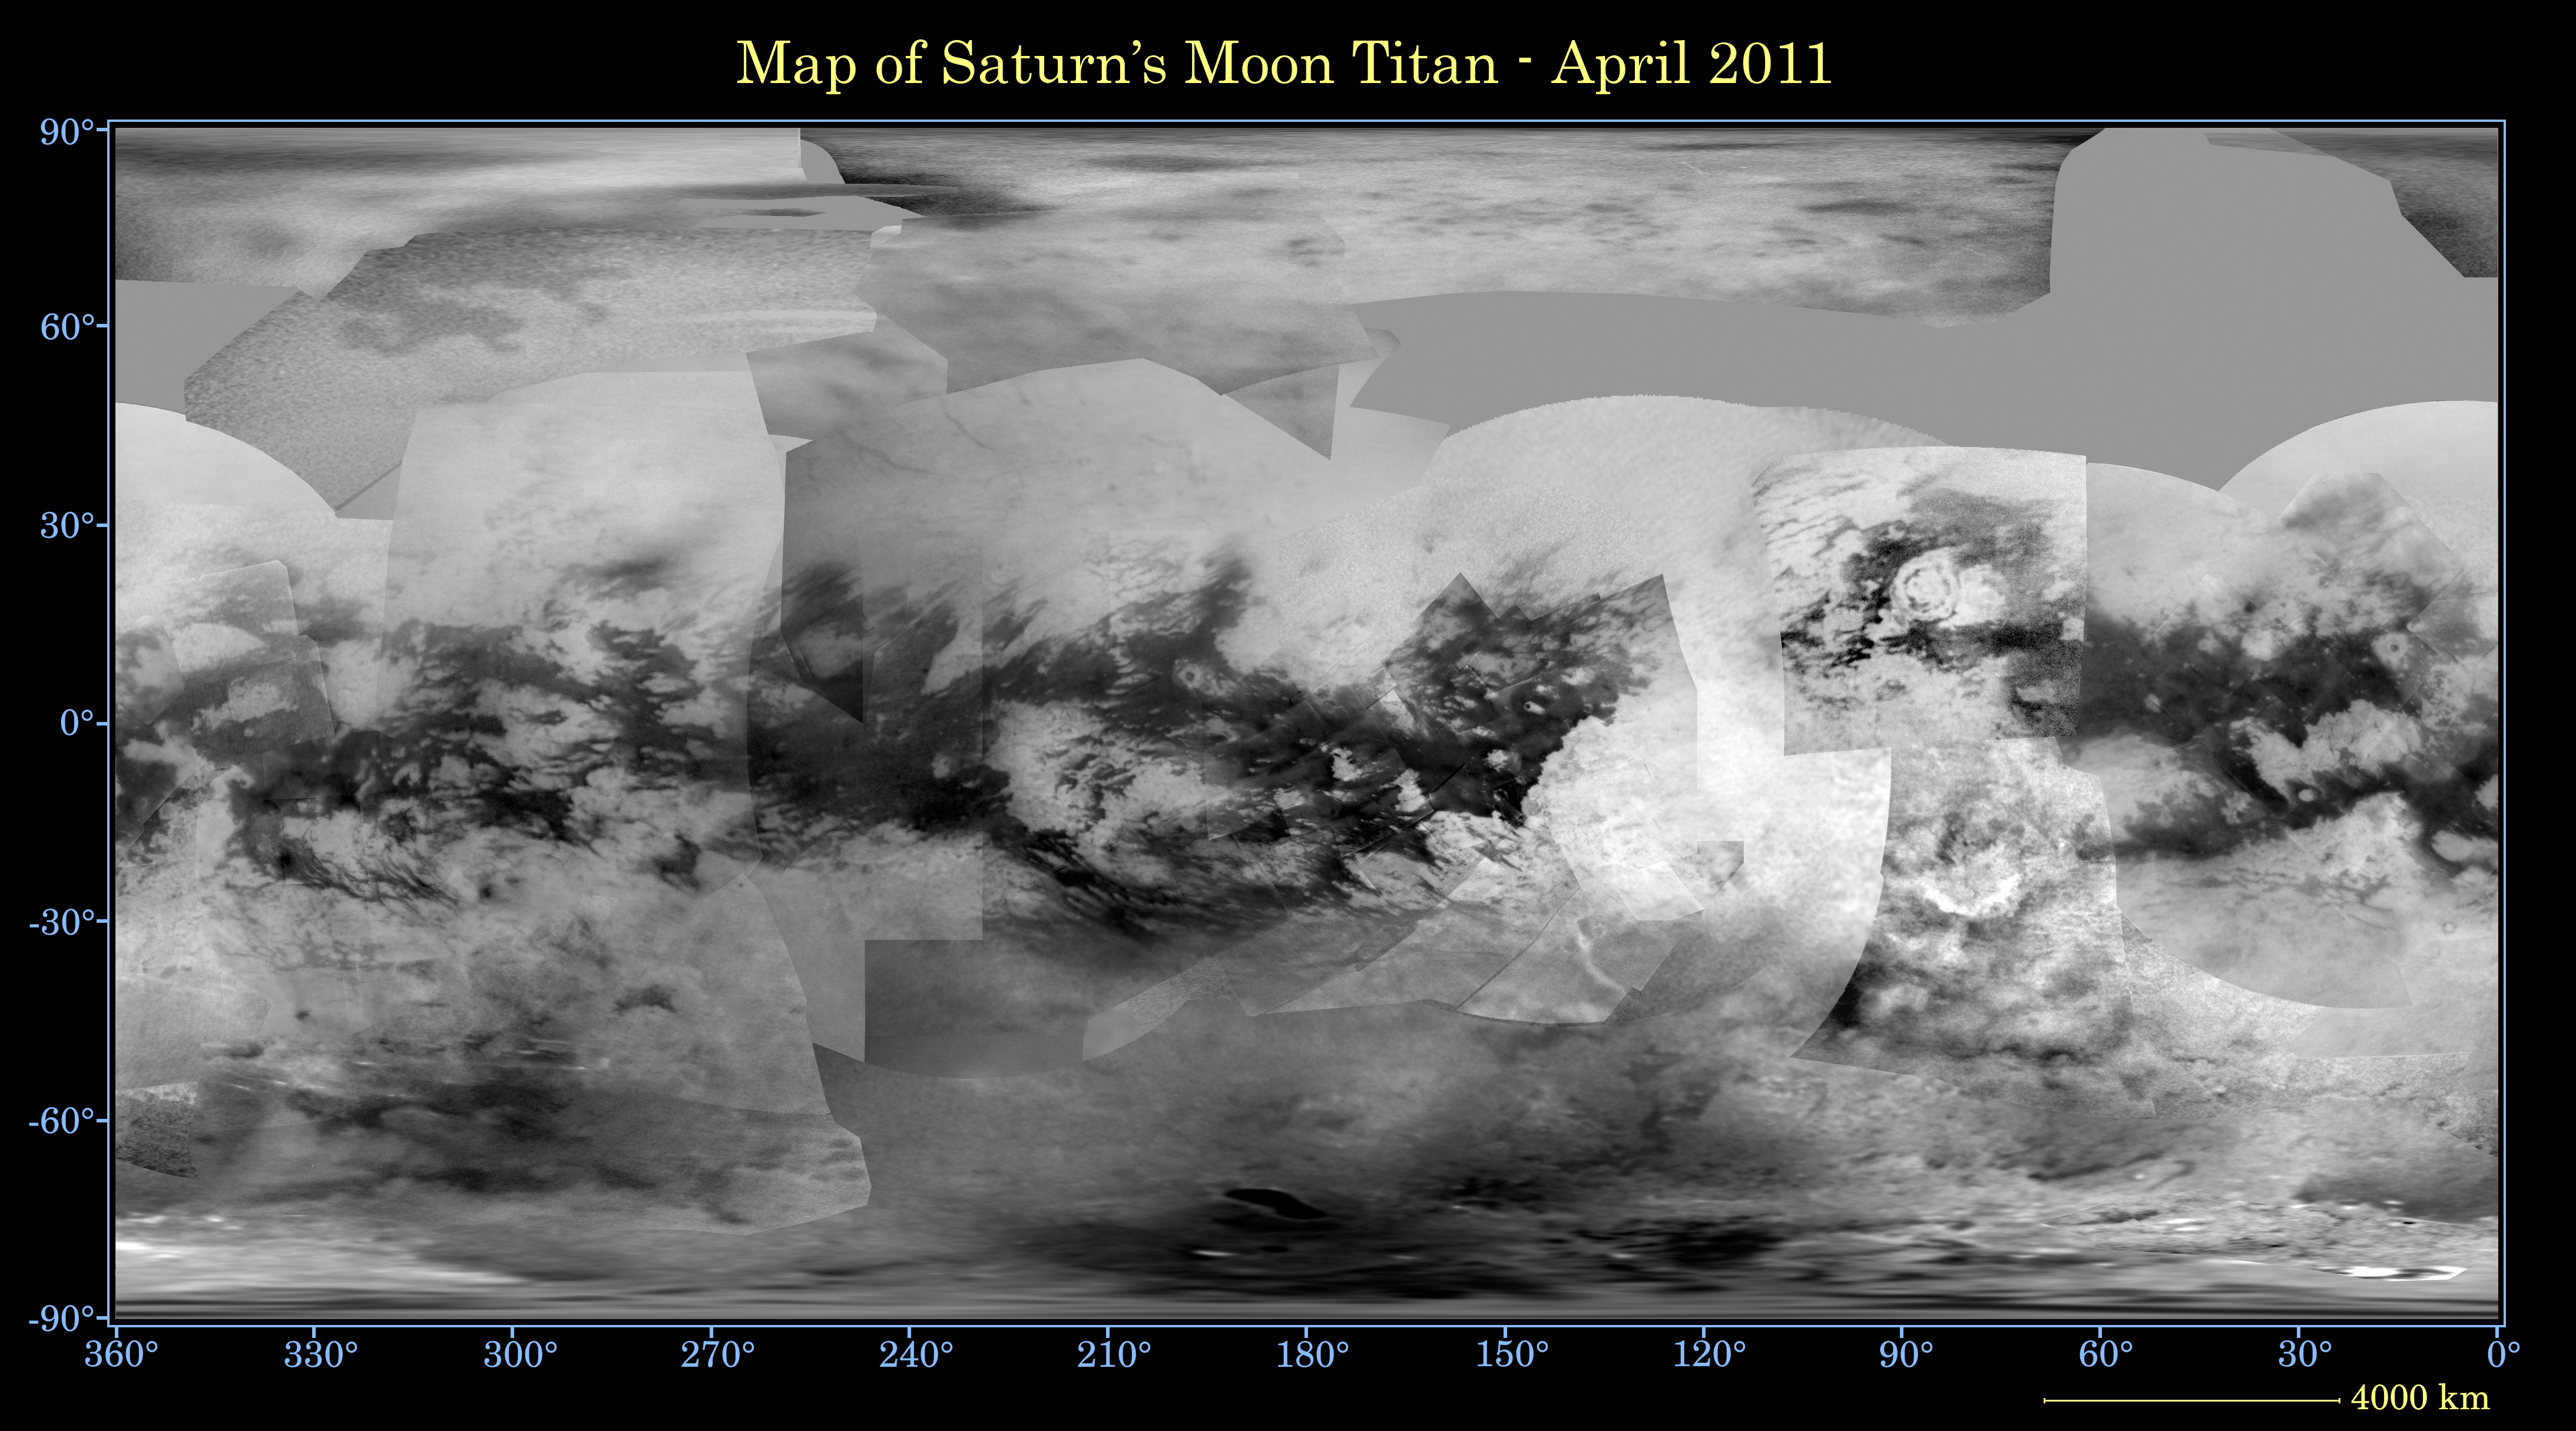
English: This global digital map of Saturn's moon Titan was created using images taken by the Cassini spacecraft's imaging science subsystem (ISS).
The images were taken using a filter centred at 938 nanometres, allowing researchers to examine variations in albedo (or inherent brightness) variations across the surface of Titan. Because of the scattering of light by Titan's dense atmosphere, no topographic shading is visible in these images. The map is an equidistant projection and has a scale of 4 kilometres per pixel. Actual resolution varies greatly across the map, with the best coverage (close to the map scale) along the equator near the centre of the map at 180 degrees west longitude and near the left and right edges at 0 and 360 degrees west longitude. The worst coverage is on the leading hemisphere (particularly around 120 degrees west longitude) and in some northern latitudes. Coverage in the northern polar region continues to improve as the north pole comes out of shadow after Titan's northern vernal equinox in August 2009. Large dark areas, now known to be liquid-hydrocarbon-filled lakes, have been documented at high latitudes. This map is an update to the version released in February 2009. Data from the last two years, including the most recent data in the map from April 2011, have improved coverage in the southern trailing hemisphere and over portions of the north polar region. The mean radius of Titan used for projection of this map is 2,575 kilometres. Titan is assumed to be spherical until a control network -- a model of the moon's shape based on multiple images tied together at defined points on the surface -- is created at some point in the future. |
| Date | |
| Source | CICLOPS |
| Author | NASA/JPL-Caltech/Space Science Institute |
Licensing
[edit]
| This file is in the public domain in the United States because it was solely created by NASA. NASA copyright policy states that "NASA material is not protected by copyright unless noted". (See Template:PD-USGov, NASA copyright policy page or JPL Image Use Policy.) | ||
 |
Warnings:
|
File history
Click on a date/time to view the file as it appeared at that time.
| Date/Time | Thumbnail | Dimensions | User | Comment | |
|---|---|---|---|---|---|
| current | 14:30, 27 October 2011 | | 4,374 × 2,430 (2.25 MB) | Originalwana (talk | contribs) | {{Information |Description ={{en|1=This global digital map of Saturn's moon Titan was created using images taken by the Cassini spacecraft's imaging science subsystem (ISS). The images were taken using a filter centred at 938 nanometres, allowing rese |
You cannot overwrite this file.
File usage on Commons
There are no pages that use this file.
File usage on other wikis
The following other wikis use this file:
- Usage on fr.wikipedia.org
- Usage on id.wikipedia.org
- Usage on it.wikipedia.org
- Usage on lb.wikipedia.org
- Usage on nl.wikipedia.org
- Usage on no.wikipedia.org
- Usage on pl.wikipedia.org
- Usage on ro.wikipedia.org
- Usage on www.wikidata.org