File:MDS plot of pairwise Fst-values and mtDNA haplogroup distribution of Myanmar and 12 other Asian regions.png
Jump to navigation
Jump to search
Size of this preview: 800 × 558 pixels. Other resolutions: 320 × 223 pixels | 640 × 447 pixels | 1,024 × 715 pixels | 1,168 × 815 pixels.
Original file (1,168 × 815 pixels, file size: 303 KB, MIME type: image/png)
Captions
Captions
Add a one-line explanation of what this file represents
| Description |
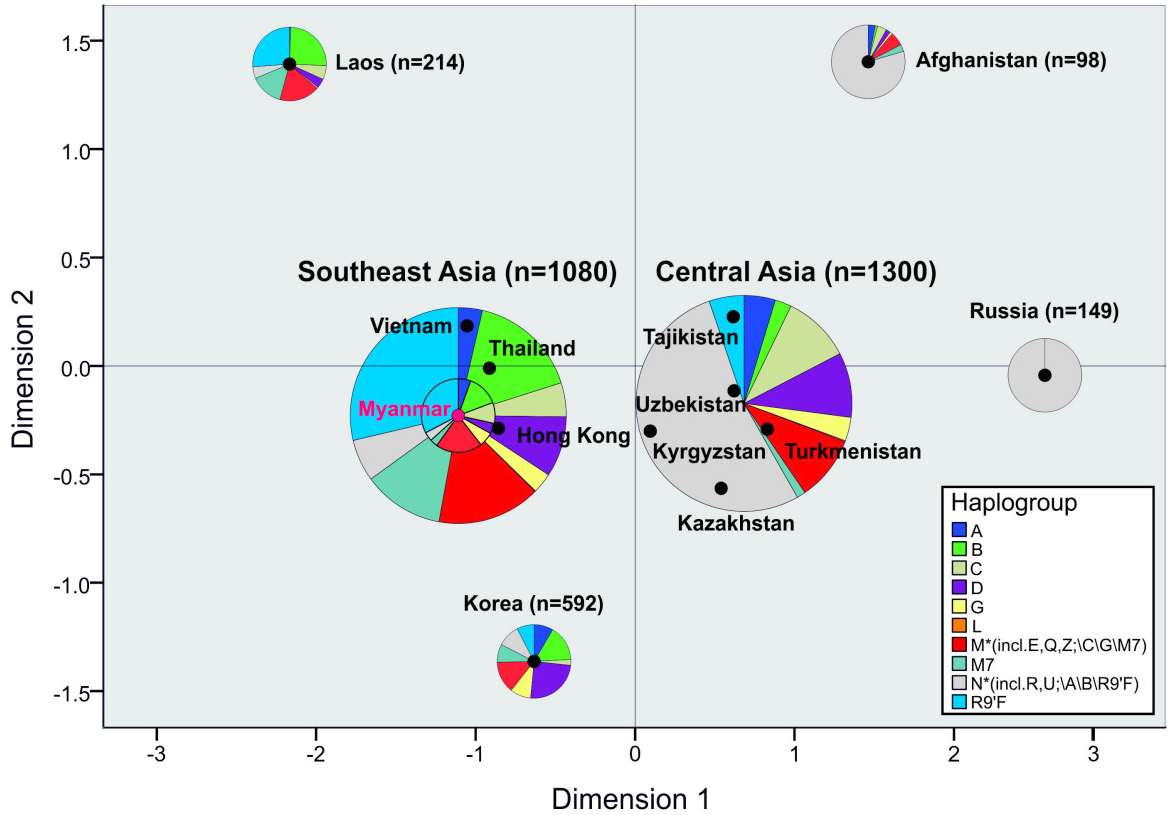
English: Multi-dimensional scaling plot of pairwise Fst-values and haplogroup distribution of populations from Myanmar and 12 other Asian regions. A distinct geographic pattern appeared in the multi-dimensional scaling plot (Stress = 0.086; R2 = 0.970) of pairwise Fst-values: The Myanmar sample fitted very well within the Southeast Asian cluster, the Central Asian populations formed a second cluster, the Korean sample represented East Asia, the Afghanistan population was representative for South Asia and Russia symbolized Western Eurasia. The main haplogroup distributions are displayed as pie charts. The size of the pie diagrams corresponds to sample size. The proportion of N-lineages (without A,B and R9’F) increases from very low percentages in Southeast and East Asia over 50% in Central Asia to more than 75% in Afghanistan and 100% in the sample of Russian origin. The proportion of the American founding haplogroups A,B,C and D displayed an interesting pattern: from inexistent in Russians it increased to more than 50% in East Asian Korea. |
| Date | Published: 28 January 2014 |
| Source | Monika Summerer et al. "Large-scale mitochondrial DNA analysis in Southeast Asia reveals evolutionary effects of cultural isolation in the multi-ethnic population of Myanmar" BMC Evolutionary Biology201414:17 DOI: 10.1186/1471-2148-14-17 http://bmcevolbiol.biomedcentral.com/articles/10.1186/1471-2148-14-17 |
| Author | Monika Summerer, Jürgen Horst, Gertraud Erhart, Hansi Weißensteiner, Sebastian Schönherr, Dominic Pacher, Lukas Forer, David Horst, Angelika Manhart, Basil Horst, Torpong Sanguansermsri and Anita Kloss-Brandstätter |
| Other versions |
  |
This file is licensed under the Creative Commons Attribution 2.0 Generic license.
|
This file was published in a BioMed Central journal. Their website states that all of its research publications is published under the license which is identical to the Creative Commons Attribution 2.0 license (some non-research articles like reviews or editorials may require a subscription.)
To the uploader: You must provide a link (URL) to the original file or journal article.
|
File history
Click on a date/time to view the file as it appeared at that time.
| Date/Time | Thumbnail | Dimensions | User | Comment | |
|---|---|---|---|---|---|
| current | 20:36, 26 July 2016 | | 1,168 × 815 (303 KB) | Was a bee (talk | contribs) | {{Information |Description={{en|1=Multi-dimensional scaling plot of pairwise Fst-values and haplogroup distribution of populations from Myanmar and 12 other Asian regions. A distinct geographic pattern appeared in the multi-dimensional scaling plot (St... |
You cannot overwrite this file.
File usage on Commons
The following 2 pages use this file: