File:Limiting global warming to 2 degrees Celsius - options to reduce greenhouse gas emissions (PBL)TR.svg

Original file (SVG file, nominally 980 × 1,020 pixels, file size: 90 KB)
Captions
Captions
Summary
[edit]TR.svg&action=edit§ion=1)
| Description |
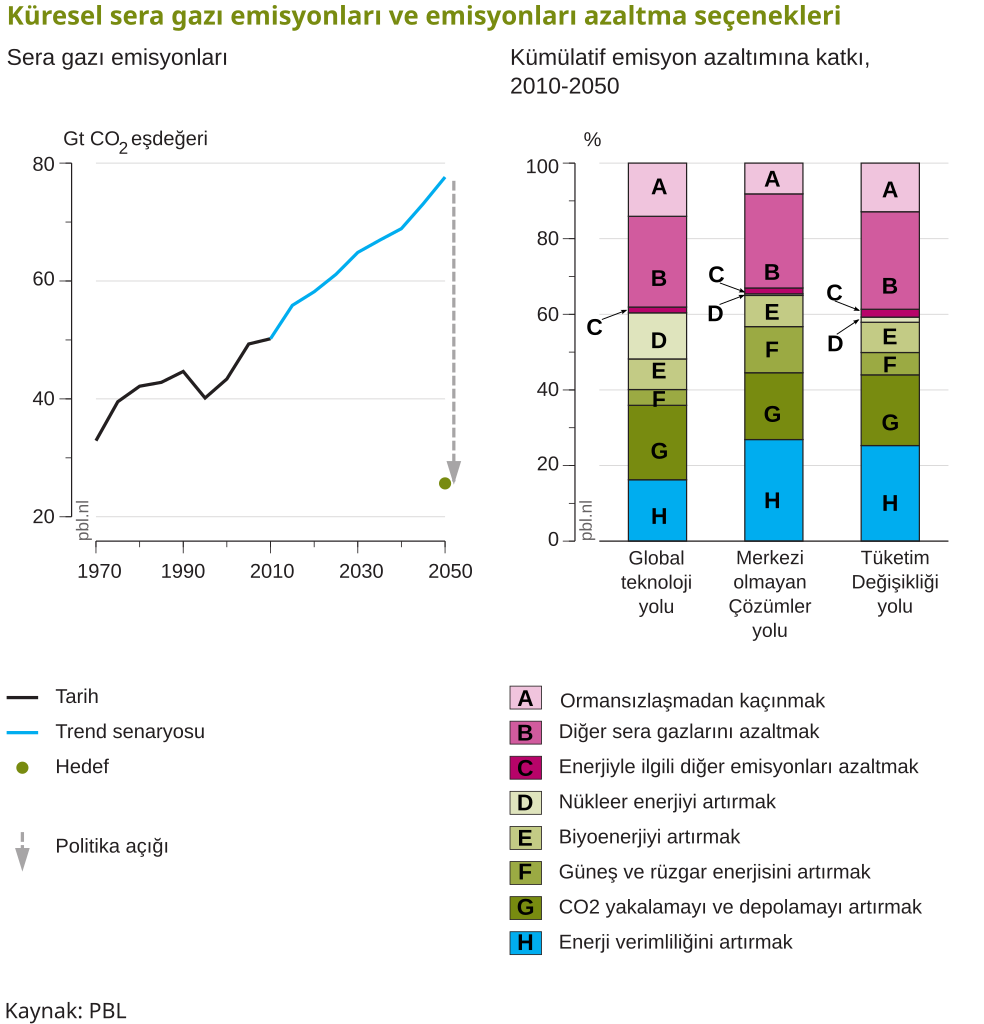
Türkçe: Bu görüntü iki grafik göstermektedir. Grafikler, küresel ısınmanın sanayi öncesi seviyeye göre nasıl 2 santigrat derecenin altında tutulabileceğini göstermektedir.
Sera gazı emisyonları Soldaki grafik, küresel sera gazı (GHG) emisyonlarının (karbondioksit eşdeğerleri, CO2e cinsinden ölçülen) 2050 yılına kadar yılda yaklaşık 20-25 gigaton (Gt) CO2'ye nasıl düşürülmesi gerektiğini göstermektedir (PBL, 2012, s. 156). Bu, 1990 emisyon seviyelerine kıyasla 2050'deki % 40-60 arasındaki azalmaya eşdeğerdir (PBL, 2012, s.157).Grafik, 2050 yılına kadar emisyonların yılda 60-70 GtCO2'ye kadar bir trend senaryosunda nasıl artacağını öngörmektedir (PBL, 2012, s.156). Eğilim senaryosu gerçekleşirse, 2100'de küresel sıcaklık 2,5-5 ° C artmış olacaktır (PBL, 2012, s.156). Başka bir deyişle, 2 ° C hedefine ulaşmak, eğilim senaryosuna kıyasla ciddi emisyon azaltımları gerektirecektir. Kümülatif emisyon azaltımına katkı, 2010-2050 Sağdaki grafik 2 ° C hedefine nasıl ulaşılabileceğini gösterir. Grafik, 2 ° C hedefine ulaşmak için "küresel teknoloji", "merkezi olmayan çözümler" ve "tüketim değişikliği" etiketli üç "yol" göstermektedir. Her bir yol, çeşitli önlemlerin emisyon azaltımlarına nasıl katkıda bulunabileceğini göstermektedir. Bunlar:(A) ormansızlaşmayı önlemek(B) diğer (CO2 olmayan) GHG'leri azaltma(C) enerjiyle ilgili diğer emisyonları azaltmak(D) nükleer enerjiyi artırmak(E) biyo-enerjiyi artırmak(F) güneş ve rüzgar enerjisini artırmak(G) CO2 yakalamayı ve depolamayı arttırmak(H) enerji verimliliğini artırmak. Üç yolun tümü için, (B), (G) ve (H) emisyon azaltımlarına önemli katkılar yapmaktadır. Aşağıda (A) - (H) 'nin üç yola yaklaşık katkıları verilmiştir. Birimler, 2010-2050 yılları arasındaki kümülatif emisyon azaltımına yüzde katkıdır. İlk sayı "küresel teknoloji" yolu, ikinci "merkezi olmayan çözümler" ve üçüncü "tüketim değişikliği" dir. (A) 14, 8, 13 (B) 24, 25, 26 (C) 3, 2.5, 2.5 (D) 12, 1, 1.5 (E) 8, 7, 8 (K) 4, 12, 6 (G) 20, 17, 18.5 (H) 17, 27, 25 |
| Date | |
| Source | vectorization from File:Limiting global warming to 2 degrees Celsius - options to reduce greenhouse gas emissions (PBL).png, origin: Figure 6.14, in: PBL Netherlands Environment Agency (15 June 2012), “Chapter 6: The energy and climate challenge”, in van Vuuren, D. and M. Kok, editors, Roads from Rio+20[1], ISBN 978-90-78645-98-6, p.177, Report no: 500062001. Report website. |
| Author | Pavouk, origin: PBL Netherlands Environmental Assessment Agency, derivative: uralunlucayakli |
Licensing
[edit]TR.svg&action=edit§ion=2)
- You are free:
- to share – to copy, distribute and transmit the work
- to remix – to adapt the work
- Under the following conditions:
- attribution – You must give appropriate credit, provide a link to the license, and indicate if changes were made. You may do so in any reasonable manner, but not in any way that suggests the licensor endorses you or your use.
- share alike – If you remix, transform, or build upon the material, you must distribute your contributions under the same or compatible license as the original.
File history
Click on a date/time to view the file as it appeared at that time.
| Date/Time | Thumbnail | Dimensions | User | Comment | |
|---|---|---|---|---|---|
| current | 14:55, 17 March 2020 | | 980 × 1,020 (90 KB) | Uralunlucayakli (talk | contribs) | Uploaded a work by Pavouk, origin: PBL Netherlands Environmental Assessment Agency, derivative: uralunlucayakli from vectorization from File:Limiting global warming to 2 degrees Celsius - options to reduce greenhouse gas emissions (PBL).png, origin: Figure 6.14, in: PBL Netherlands Environment Agency (15 June 2012), “Chapter 6: The energy and climate challenge”, in van Vuuren, D. and M. Kok, editors, Roads from Rio+20[1], ISBN 978-90-78645-98-6, p.177, Report no: 500062001. Report website. wi... |
You cannot overwrite this file.
File usage on Commons
There are no pages that use this file.
File usage on other wikis
The following other wikis use this file:
- Usage on tr.wikipedia.org
TR.svg&oldid=815162678)