File:LCL-determination.png
Jump to navigation
Jump to search
Size of this preview: 800 × 510 pixels. Other resolutions: 320 × 204 pixels | 640 × 408 pixels | 1,024 × 653 pixels | 1,264 × 806 pixels.
Original file (1,264 × 806 pixels, file size: 51 KB, MIME type: image/png)
Captions
Captions
Add a one-line explanation of what this file represents
Summary
[edit]
| Description |
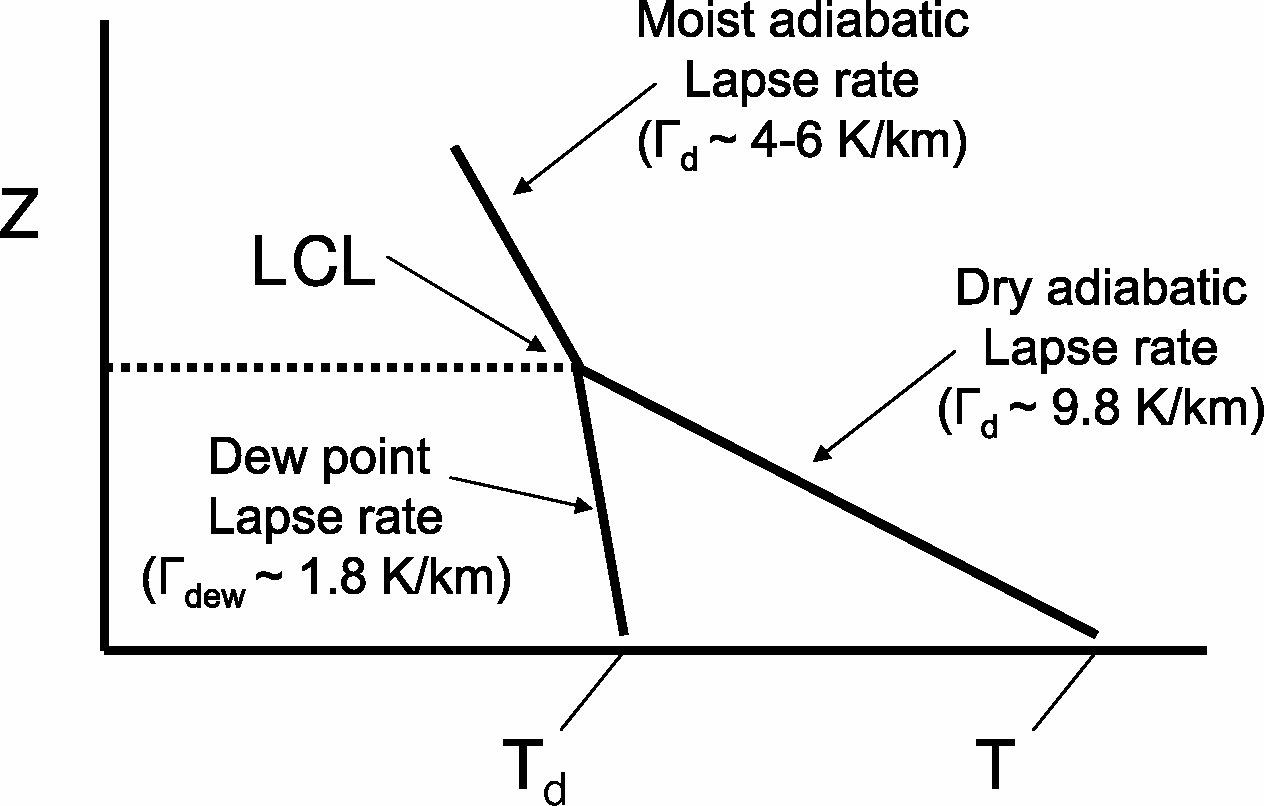
English: Schematic of the Lifting Condensation Level (LCL) in relation to the temperature and dew point and their vertical profiles; the moist adiabatic temperature curve above the LCL is also sketched for reference. |
| Date | |
| Source | Own work |
| Author | Frogsaregreen |

|
This physics image could be re-created using vector graphics as an SVG file. This has several advantages; see Commons:Media for cleanup for more information. If an SVG form of this image is available, please upload it and afterwards replace this template with
{{vector version available|new image name}}.
It is recommended to name the SVG file “LCL-determination.svg”—then the template Vector version available (or Vva) does not need the new image name parameter. |
Licensing
[edit]
I, the copyright holder of this work, hereby publish it under the following license:
This file is licensed under the Creative Commons Attribution-Share Alike 3.0 Unported license.
- You are free:
- to share – to copy, distribute and transmit the work
- to remix – to adapt the work
- Under the following conditions:
- attribution – You must give appropriate credit, provide a link to the license, and indicate if changes were made. You may do so in any reasonable manner, but not in any way that suggests the licensor endorses you or your use.
- share alike – If you remix, transform, or build upon the material, you must distribute your contributions under the same or compatible license as the original.
File history
Click on a date/time to view the file as it appeared at that time.
| Date/Time | Thumbnail | Dimensions | User | Comment | |
|---|---|---|---|---|---|
| current | 16:23, 9 March 2009 | | 1,264 × 806 (51 KB) | Frogsaregreen (talk | contribs) | {{Information |Description={{en|1=Schematic of the Lifting Condensation Level (LCL) in relation to the temperature and dew point and their vertical profiles; the moist adiabatic temperature curve above the LCL is also sketched for reference.}} |Source=Own |
You cannot overwrite this file.
File usage on Commons
There are no pages that use this file.
File usage on other wikis
The following other wikis use this file:
- Usage on en.wikipedia.org
- Usage on es.wikipedia.org
- Usage on it.wikipedia.org