File:Kilonova emission spectrum (weic2325d).jpg
Jump to navigation
Jump to search

Size of this preview: 800 × 450 pixels. Other resolutions: 320 × 180 pixels | 640 × 360 pixels | 1,024 × 576 pixels | 1,280 × 720 pixels | 2,560 × 1,440 pixels | 3,841 × 2,160 pixels.
Original file (3,841 × 2,160 pixels, file size: 384 KB, MIME type: image/jpeg)
Captions
Captions
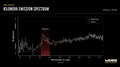
This graphic presentation compares the spectral data of GRB 230307A’s kilonova as observed by the James Webb Space Telescope and a kilonova model.
Summary
[edit]| Description |
English: This graphic presentation compares the spectral data of GRB 230307A’s kilonova as observed by the James Webb Space Telescope and a kilonova model. Both show a distinct peak in the region of the spectrum associated with tellurium, with the area shaded in red. The detection of tellurium, which is rarer than platinum on Earth, marks Webb’s first direct look at an individual heavy element from a kilonova.Though astronomers have theorised neutron star mergers to be the ideal environment to create chemical elements, including some that are essential to life, these explosive events—known as kilonovas—are rare and rapid. Webb’s NIRSpec (Near-Infrared Spectrograph) acquired a spectrum of GRB 230307A’s kilonova, helping scientists secure evidence of the synthesis of heavy elements from neutron star mergers.With Webb’s extraordinary ability to look further into space than ever before, astronomers expect to find even more kilonovas and acquire further evidence of heavy element creation.[Image description: The spectrum is plotted as a line graph of brightness versus wavelength of light (microns). The spectral lines range in wavelength of light along the x-axis, with the first tic labelled as “1.0” and the last tic labelled as “5.0,” and in brightness, with the level of brightness becoming greater moving higher along the y-axis. The Webb spectral line is white and jagged. About a third of the way across the graph, there is a distinct peak between 2.0 and 2.5 microns. After 2.5 microns, the spectral line slopes gradually up to the right. The model spectral line is red and smoother than the Webb data. The model’s spectral line at 1.0 micron begins low (dim) and flat before peaking between 2.0 and 2.5 microns, similar to the Webb data. The area below the model spectral line is shaded red and labelled “Tellurium T E.” The model spectral line then descends after 2.5 microns and follows the general trend of the Webb data.] |
| Date | 25 October 2023 (upload date) |
| Source | Kilonova emission spectrum |
| Author | NASA, ESA, CSA, J. Olmsted (STScI) |
| Other versions |
|
.jpg&action=edit§ion=1)
Licensing
[edit].jpg&action=edit§ion=2)
 |
ESA/Webb images, videos and web texts are released by the ESA under the Creative Commons Attribution 4.0 International license and may on a non-exclusive basis be reproduced without fee provided they are clearly and visibly credited. Detailed conditions are below; see the ESA copyright statement for full information. For images created by NASA or on the webbtelescope.org website, use the {{PD-Webb}} tag.
Conditions:
Notes:
|
 |
This file is licensed under the Creative Commons Attribution 4.0 International license.
Attribution: NASA, ESA, CSA, J. Olmsted (STScI)
- You are free:
- to share – to copy, distribute and transmit the work
- to remix – to adapt the work
- Under the following conditions:
- attribution – You must give appropriate credit, provide a link to the license, and indicate if changes were made. You may do so in any reasonable manner, but not in any way that suggests the licensor endorses you or your use.
File history
Click on a date/time to view the file as it appeared at that time.
| Date/Time | Thumbnail | Dimensions | User | Comment | |
|---|---|---|---|---|---|
| current | 10:00, 26 October 2023 | | 3,841 × 2,160 (384 KB) | OptimusPrimeBot (talk | contribs) | #Spacemedia - Upload of https://cdn.esawebb.org/archives/images/large/weic2325d.jpg via Commons:Spacemedia |
You cannot overwrite this file.
File usage on Commons
The following page uses this file:
.jpg&oldid=909528635)