File:Kevin Pietersen graph.png
Jump to navigation
Jump to search
Size of this preview: 800 × 466 pixels. Other resolutions: 320 × 186 pixels | 640 × 373 pixels | 986 × 574 pixels.
Original file (986 × 574 pixels, file size: 5 KB, MIME type: image/png)
Captions
Captions
Add a one-line explanation of what this file represents
Summary
[edit]
| Description |
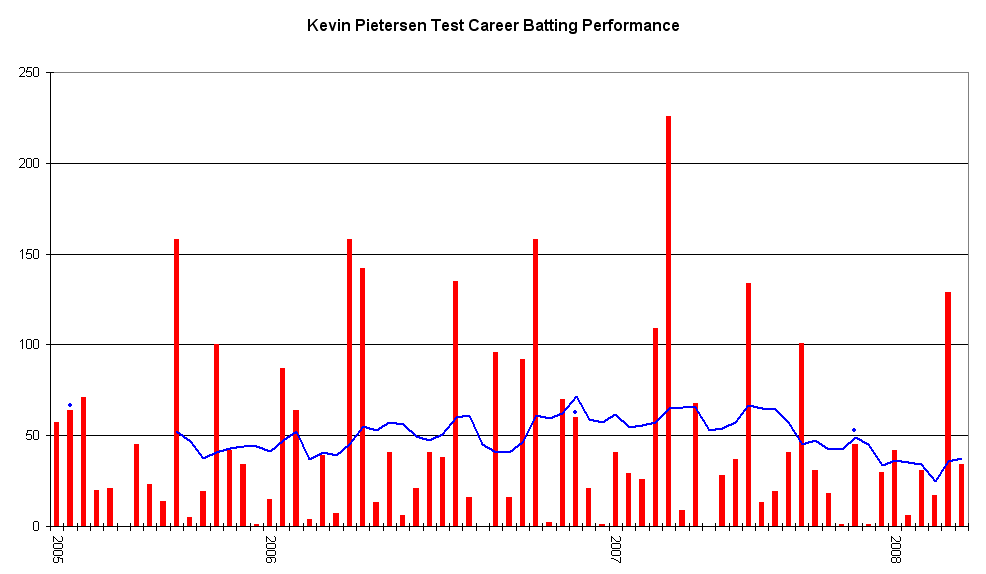
English: This graph details the Test Match performance of Kevin Pietersen. It was created by Raven4x4x. The red bars indicate the player's test match innings, while the blue line shows the average of the ten most recent innings at that point. Note that this average cannot be calculated for the first nine innings. The blue dots indicate innings in which Pietersen finished not-out.
This graph was generated with Microsoft Excel 2002, using data from Cricinfo [1] and Howstat [2]. The information in this chart is current as of 30 March 2008. |
| Date | 25 June 2006 (original upload date) |
| Source |
Own work Transferred from en.wikipedia |
| Author | Raven4x4x at en.wikipedia |
Licensing
[edit]
| |
This work has been released into the public domain by its author, Raven4x4x, at the English Wikipedia project. This applies worldwide. In case this is not legally possible: |
Original upload log
[edit]
The original description page was here. All following user names refer to en.wikipedia.
- 2006-06-25 04:30 Raven4x4x 963×492 (4347 bytes) This graph details the [[Test cricket|Test Match]] performance of [[Kevin Pietersen]]. It was created by [[User:Raven4x4x|Raven4x4x]]. The red bars indicate the player's test match innings, while the blue line shows the [[Batting average|average]] of the
- 2006-08-25 10:18 Raven4x4x 963×492 (4553 bytes) updated: The information in this chart is current as of 25 August 2006.
- 2007-01-10 00:46 Raven4x4x 986×574 (4642 bytes) The information in this chart is current as of 10 January 2007.
- 2007-06-20 07:31 Raven4x4x 986×574 (4584 bytes) Updated: The information in this chart is current as of 20 June 2007.
- 2007-08-28 01:43 Raven4x4x 986×574 (4818 bytes) Updated: The information in this chart is current as of 28 August 2007.
- 2007-12-23 03:12 Raven4x4x 986×574 (4960 bytes) Updated: The information in this chart is current as of 23 December 2007.
- 2008-03-30 06:28 Raven4x4x 986×574 (5059 bytes) Updated: The information in this chart is current as of 30 March 2008.
File history
Click on a date/time to view the file as it appeared at that time.
| Date/Time | Thumbnail | Dimensions | User | Comment | |
|---|---|---|---|---|---|
| current | 22:45, 27 July 2010 | | 986 × 574 (5 KB) | MGA73bot2 (talk | contribs) | == {{int:filedesc}} == {{Information |description={{en|1=This graph details the Test Match performance of Kevin Pietersen. It was created by Raven4x4x. The red bars indicate the player's |
You cannot overwrite this file.
File usage on Commons
There are no pages that use this file.