File:Itanium Sales Forecasts.png
Jump to navigation
Jump to search

Size of this preview: 800 × 544 pixels. Other resolutions: 320 × 217 pixels | 640 × 435 pixels | 1,042 × 708 pixels.
Original file (1,042 × 708 pixels, file size: 2.11 MB, MIME type: image/png)
Captions
Captions
Add a one-line explanation of what this file represents
Summary
[edit]
| Description |
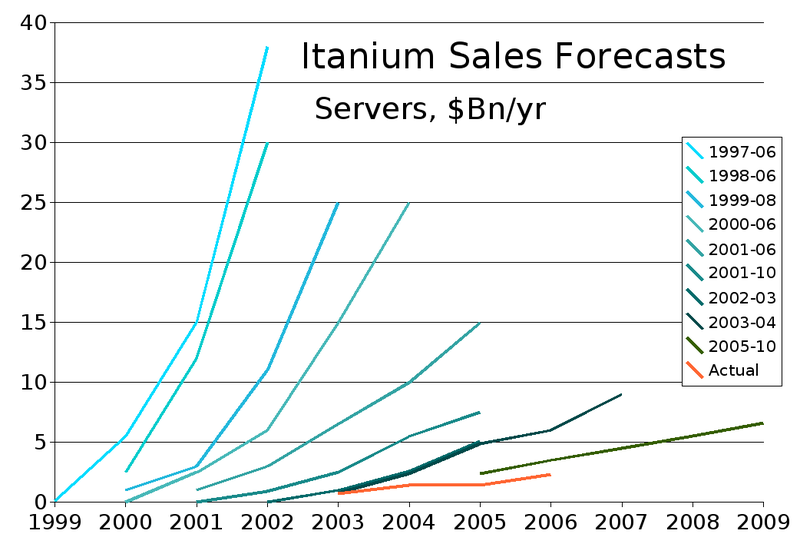
Graphs of various forecasts of Itanium server sales over time. I, Arch_Dude, am the creator of this chart. I used Openoffice.calc to graph data taken from a chart on the web and from articles on the web. I then converted to PNG since my export to SVG failed. Data points are yearly global server sales in Billions USD. Chart is intended for the new consolidated Itanium article at Wikipedia.en. |
| Date | 31 March 2007 (original upload date) |
| Source | No machine-readable source provided. Own work assumed (based on copyright claims). |
| Author | No machine-readable author provided. Arch dude assumed (based on copyright claims). |
References
[edit]
- Mining Itanium, CNet News December 7, 2005, accessed 2007-03-19
- Customer Perceptions of the Future of Itanium archive copy at the Wayback Machine, Michelle Bailey et al., IDC, February 2006, accessed 2007-03-22
Licensing
[edit]
I, the copyright holder of this work, hereby publish it under the following licenses:

|
Permission is granted to copy, distribute and/or modify this document under the terms of the GNU Free Documentation License, Version 1.2 or any later version published by the Free Software Foundation; with no Invariant Sections, no Front-Cover Texts, and no Back-Cover Texts. A copy of the license is included in the section entitled GNU Free Documentation License. |
| This file is licensed under the Creative Commons Attribution-Share Alike 3.0 Unported license. | ||
| ||
| This licensing tag was added to this file as part of the GFDL licensing update. |
This file is licensed under the Creative Commons Attribution-Share Alike 2.5 Generic, 2.0 Generic and 1.0 Generic license.
- You are free:
- to share – to copy, distribute and transmit the work
- to remix – to adapt the work
- Under the following conditions:
- attribution – You must give appropriate credit, provide a link to the license, and indicate if changes were made. You may do so in any reasonable manner, but not in any way that suggests the licensor endorses you or your use.
- share alike – If you remix, transform, or build upon the material, you must distribute your contributions under the same or compatible license as the original.
You may select the license of your choice.
File history
Click on a date/time to view the file as it appeared at that time.
| Date/Time | Thumbnail | Dimensions | User | Comment | |
|---|---|---|---|---|---|
| current | 22:19, 15 April 2007 | | 1,042 × 708 (2.11 MB) | Arch dude (talk | contribs) | I, Arch_dude, created this chart based on data found in charts and documents found on the Internet. This update adds data points, improves the colors, and makes better use of the vertical space. It is also larger to permit better rescaling. |
| 21:01, 31 March 2007 |  | 538 × 298 (19 KB) | Arch dude (talk | contribs) | Graphs of various forecasts of Itanium server sales over time. I, Arch_Dude, am the creator of this chart. I used Openoffice.calc to graph data taken from a chart on the web and from articles on the web. I then converted to PNG since my export to SVG fail |
You cannot overwrite this file.
File usage on Commons
There are no pages that use this file.
File usage on other wikis
The following other wikis use this file:
- Usage on pt.wikipedia.org