File:IV EV 2.png

Original file (659 × 666 pixels, file size: 11 KB, MIME type: image/png)
Captions
Captions
Summary
[edit]
| Description |
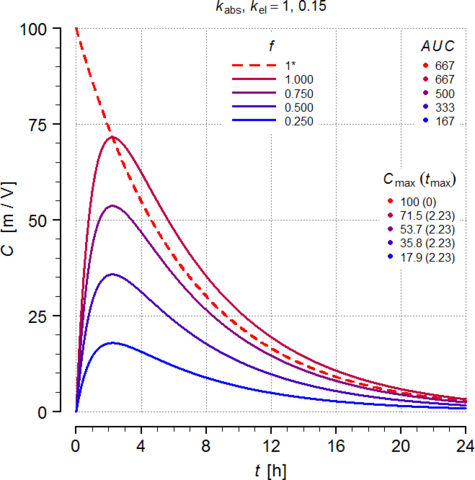
English: Plasma-time curves after IV and EV administration; variable fractions absorbed
Deutsch: Plasma-Zeit Kurven nach IV und EV Verabreichung; variabler absorbierter Anteil
Español: Curvas plasma-tiempo tras la administración IV y EV; fracciones variables absorbidas |
| Date | |
| Source | Own work |
| Author | Alfie↑↓© (Helmut Schütz) |
R-script to reproduce the graphics and additional data frame of results
# CC-BY Helmut Schütz 2024
op <- par()
par("mar" = c(4.1, 4.6, 1, 0), ljoin = "mitre", lend = "square", font.main = 1, cex.main = 1.25, cex.axis = 1.5, cex.lab = 1.5, las = 1)
D <- 100 # dose
V <- 1 # volume of distribution
f <- 1 # fraction absorbed
kel <- 0.15 # elimination rate constant
kabs <- c(2, 1, 0.5, 0.25) # IR: absorption rate constants
kabs <- c(kabs, kel / 3) # MR: abs. slower than el.
t <- seq(0, 24, length.out = 5001) # times
# one-compartment model, zero-order input, first-order elimination
tmax <- log(kabs / kel) / (kabs - kel)
Cmax <- D * f * kabs / (V * (kabs - kel)) * exp(-kel * tmax) - exp(-kabs * tmax))
AUC <- D * f / V / kel
x.int <- 4
y.int <- 25
xs <- seq(0, 24, x.int)
ys <- seq(0, 100, y.int)
plot(1, 1, xlim = c(0, 24), ylim = c(0, 100), type = "n", axes = FALSE, xlab = expression(italic(t) * " [h]"), ylab = expression(italic(C) * " [m / V]"), main = bquote(italic(k)[el] == . ((sprintf("%.3g", kel))))) # empty plot
for (i in seq_along(xs)) { # x-grid
lines(x = rep(xs[i], 2), y = c(0, 100), col = "gray50", lty = 3, lwd = 1.25)
}
for (i in seq_along(ys)) { # y-grid
lines(x = c(0, 24), y = rep(ys[i], 2),col = "gray50", lty = 3, lwd = 1.25)
}

axis(side = 1, at = seq(0, 24, by = 4), lwd = 2.5)

axis(side = 1, at = 0:24, lwd = 1.25, tcl = -0.35, labels = FALSE)

axis(side = 2, at = seq(0, 100, by = 25), lwd = 2.5)

axis(side = 2, at = seq(0, 100, by = 5), lwd = 1.25, tcl = -0.35, labels = FALSE)

clr <- colorRampPalette(c("red", "blue"))((length(kabs) + 1))[-1]

C <- D / V * (exp(-kel * t)) # IV

lines(t, C, col = "red", lwd = 3, lty = 2)

for (i in seq_along(kabs)) { # EV

if (!isTRUE(all.equal(kabs[i], kel))) { # common: kabs # kel

C <- D * f * kabs[i] / (V * (kabs[i] - kel)) * (exp(-kel * t) - exp(-kabs[i] * t))

} else { # flip flop: kabs = kel

k <- kel

C <- D * f / V * k * t * exp(-k * t)

tmax[i] <- 1 / k

Cmax[i] <- D * f / V * k * tmax[i] * exp(-k * tmax[i])

}

lines(t, C, col = clr[i], lwd = 3, lend = "round", ljoin = "round")

}

lgd <- c(" –", sprintf("%.3f", kabs))

legend("top", inset = 0.05, box.lty = 0, bg = "white", lwd = 3, col = c("red", clr), title.cex = 1.25, title = expression(italic(k)[abs]), legend = lgd, lty = c(2, rep(1, length(f))), seg.len = 4)

lgd <- sprintf("%.0f", rep(AUC, length(kabs) + 1))

legend("topright", inset = 0.05, box.lty = 0, bg = "white", col = c("red", clr), title.cex = 1.25, title = expression(italic(AUC)), legend = lgd, pch = 19, pt.cex = 1)

lgd[1] <- bquote(.((sprintf("%.0f (%.0g)", D * f / V, 0))))

for (i in seq_along(Cmax)) {

lgd[i + 1] <- bquote(.((sprintf("%.1f (%5.1f)", Cmax[i], tmax[i]))))

}

legend("right", inset = 0.05, box.lty = 0, bg = "white", col = c("red", clr), title.cex = 1.25, title = expression(italic(C)[max]*" "*(italic(t)[max])), legend = lgd, pch = 19, pt.cex = 1)

par<- op

PK <- data.frame(admin = c("IV", rep("PO", length(kabs))), form = c("IV", rep("IR", length(kabs) - 1), "MR"), f = f, D = D, V = V, kel = kel, kabs = c(NA, kabs), tmax = c(0, tmax), Cmax = c(D * f / V, Cmax), AUC = AUC)

PK[, c(3:5, 7:10)] <- signif(PK[, c(3:5, 7:10)], 3)

PK[, 7] <- sprintf("%.3f", PK[, 7])

PK[1, c(2:3, 7)] <- rep("–", 3)

txt <- paste("admin : Mode of administration", "\nform  : Formulation", "\nf     : Fraction absorbed", "\nD     : Dose", "\nV     : Volume of distribution", "\nkabs  : Absorption rate constant [1 / h]", "\nkel   : Elimination rate constant [1 / h]", "\ntmax  : Time of maximum concentration [h]", "\nCmax  : Maximum concentration [m / V]", "\nAUC   : Area Under the Curve [h × m / V]\n")

print(PK, row.names = FALSE); cat(txt)
Licensing
[edit]
I, the copyright holder of this work, hereby publish it under the following license:

 This file is licensed under the Creative Commons Attribution 4.0 International license.
- You are free:
- to share – to copy, distribute and transmit the work
- to remix – to adapt the work
- Under the following conditions:
- attribution – You must give appropriate credit, provide a link to the license, and indicate if changes were made. You may do so in any reasonable manner, but not in any way that suggests the licensor endorses you or your use.
File history
Click on a date/time to view the file as it appeared at that time.
| Date/Time | Thumbnail | Dimensions | User | Comment | |
|---|---|---|---|---|---|
| current | 07:04, 29 July 2024 | | 659 × 666 (11 KB) | Alfie66 (talk | contribs) | Top legend corrected |
| 20:05, 28 July 2024 |  | 659 × 666 (12 KB) | Alfie66 (talk | contribs) | Uploaded own work with UploadWizard |
You cannot overwrite this file.
File usage on Commons
There are no pages that use this file.
File usage on other wikis
The following other wikis use this file:
- Usage on de.wikipedia.org