File:Hypothetical dose-response.png

Original file (679 × 629 pixels, file size: 97 KB, MIME type: image/png)
Captions
Captions
Summary
[edit]
| Description |
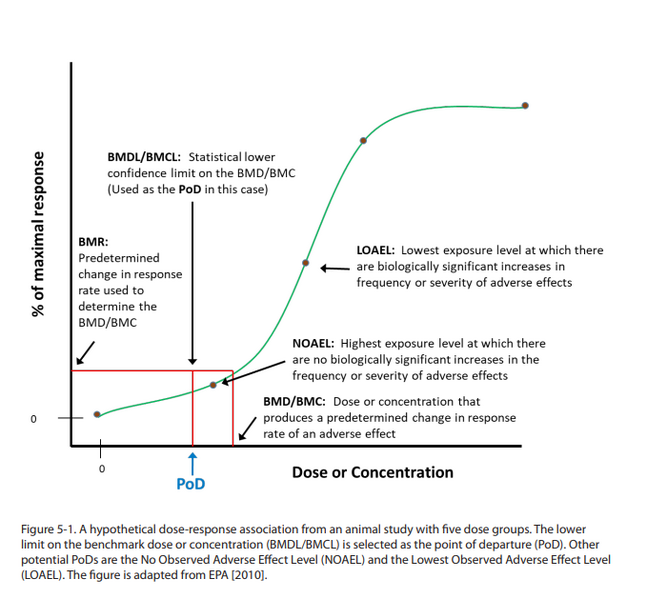
English: A hypothetical dose-response association from an animal study with five dose groups. |
| Date | March 2020 |
| Source | https://www.cdc.gov/niosh/docs/2020-106/pdfs/2020-106revised032020.pdf |
| Author | National Institute for Occupational Safety and Health |
The figure depicts a dose-response curve. A line graph with an x-axis labeled “Dose or Concentration” and a y-axis labeled as “Percent of maximal response.” A green line connects five red points on the graph with a plateau in the upper right of the graph, a positive slope in the middle of the graph, and a flattening plateau on the lower left of the graph. Two tick marks showing zero are labeled on both the x- and y-axes near the origin of the graph which shows the first point (0,0) where the line begins at the lower left. No other indicators of magnitude on either the x-axis or y-axis are given.
Two of the five points are labeled with arrows. The second point from the left is marked as the “NOAEL: Highest exposure at which there are no biologically significant increases in the frequency or severity of adverse effects.” The third point is in the central area of the positive slope and marked as the “LOAEL: Lowest exposure level at which there are biologically significant increases in frequency or severity of adverse effects.” The fourth and fifth points on the line are on the upper right of the curve and are not labeled.
Three red lines drawn around the NOAEL indicate the upper and lower statistical confidence levels of the dose on the x-axis. The vertical line to the right of the NOAEL indicates the upper confidence limit or the benchmark dose/benchmark concentration at the line connecting the curve to the x-axis. An arrow describes point this line connects to the axis as the “Dose or concentration that produces a predetermined change in response rate of an adverse effect.” This vertical red line also connects to a horizontal red line connecting the curve to the y-axis at a point labeled “Benchmark response: Predetermined change in response rate used to determine the benchmark dose/benchmark concentration.” A vertical red line to the left of the NOAEL connects down to the x-axis at a point marked with a blue arrow and called “point of departure.” Above this red line a label states: “Lower limit on the benchmark dose/ benchmark concentration: Statistical lower confidence limit on the benchmark dose/benchmark concentration (used as the point of departure in this case).”
Licensing
[edit]
This work is in the public domain in the United States because it is a work prepared by an officer or employee of the United States Government as part of that person’s official duties under the terms of Title 17, Chapter 1, Section 105 of the US Code.
Note: This only applies to original works of the Federal Government and not to the work of any individual U.S. state, territory, commonwealth, county, municipality, or any other subdivision. This template also does not apply to postage stamp designs published by the United States Postal Service since 1978. (See § 313.6(C)(1) of Compendium of U.S. Copyright Office Practices). It also does not apply to certain US coins; see The US Mint Terms of Use.
|
 | |
| This file has been identified as being free of known restrictions under copyright law, including all related and neighboring rights. | ||
File history
Click on a date/time to view the file as it appeared at that time.
| Date/Time | Thumbnail | Dimensions | User | Comment | |
|---|---|---|---|---|---|
| current | 16:24, 18 July 2024 | | 679 × 629 (97 KB) | KrystinCarlson (talk | contribs) | Uploaded a work by National Institute for Occupational Safety and Health from https://www.cdc.gov/niosh/docs/2020-106/pdfs/2020-106revised032020.pdf with UploadWizard |
You cannot overwrite this file.
File usage on Commons
There are no pages that use this file.
File usage on other wikis
The following other wikis use this file:
- Usage on en.wikipedia.org