File:Hurricane Florence Water Footprint Data Visualization.gif
Jump to navigation
Jump to search
Size of this preview: 800 × 444 pixels. Other resolutions: 320 × 178 pixels | 640 × 356 pixels.
Original file (1,080 × 600 pixels, file size: 13.62 MB, MIME type: image/gif, looped, 202 frames, 27 s)
Note: Due to technical limitations, thumbnails of high resolution GIF images such as this one will not be animated. The limit on Wikimedia Commons is width × height × number of frames ≤ 100 million.
Captions
Captions
Add a one-line explanation of what this file represents
Summary
[edit]
| Description |
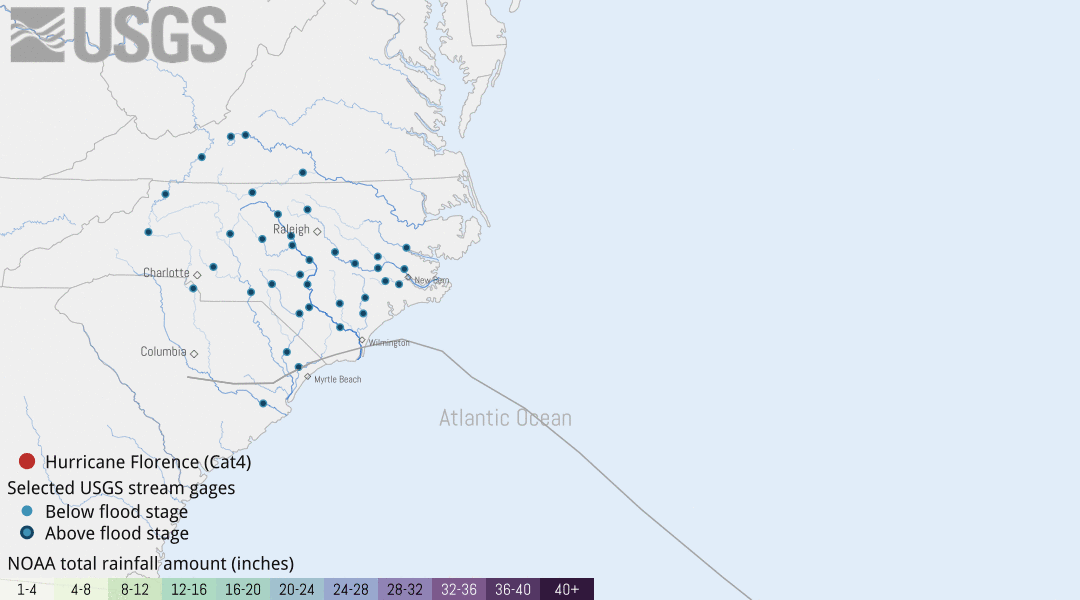
English: Watch Florence move through the Carolinas in this data visualization and see USGS streamgage measurements spike as the storm’s extreme rainfall leads to intense flooding. USGS streamgages provide critical information during storms to flood forecasters and emergency managers as they make decisions that contributes to protecting lives and property. Understanding river levels and locations of flooding can make a huge difference in these dangerous storms. The water footprint visualization shows patterns of precipitation and river discharge of 18 USGS streamgages greatly impacted by Florence.
Deutsch: Die Grafik visualisiert, wie Florence durch die beiden Carolina-Staate zieht und die vom USGS betriebenen Pegel Höchststände erreichen, weil der extreme Niederschlag des Sturms zu massiven Überschwemmungen führt. Die Pegel des USGS versorgen Hydrologen und Notfallmanager mit zeitkritischen Informationen, um diesen bei Entschiedungen zu helfen, de zum Schutze von Leben und Eigentum dienen. Das Verständnis der Wasserstände den Ort möglicher Überschwemungen kann einen großen Unterschied bereiten. Diese Visualisierung zeigt Niederschlagsmuster und Abflussmengen von 18 Pegeln des USGS, die sehr stark auf Florence reagierten. |
| Date | |
| Source | https://www.usgs.gov/news/hurricane-florence-water-footprint-data-visualization |
| Author | USGS |
Licensing
[edit]
This image is in the public domain in the United States because it only contains materials that originally came from the United States Geological Survey, an agency of the United States Department of the Interior. For more information, see the official USGS copyright policy.
|
File history
Click on a date/time to view the file as it appeared at that time.
| Date/Time | Thumbnail | Dimensions | User | Comment | |
|---|---|---|---|---|---|
| current | 20:19, 20 September 2018 | | 1,080 × 600 (13.62 MB) | Matthiasb (talk | contribs) | {{Information |description ={{en|1=Watch Florence move through the Carolinas in this data visualization and see USGS streamgage measurements spike as the storm’s extreme rainfall leads to intense flooding. USGS streamgages provide critical information during storms to flood forecasters and emergency managers as they make decisions that contributes to protecting lives and property. Understanding river levels and locations of flooding can make a huge difference in these dangerous storms. The... |
You cannot overwrite this file.
File usage on Commons
There are no pages that use this file.