File:Hubbert peak oil plot.svg
Jump to navigation
Jump to search

Size of this PNG preview of this SVG file: 600 × 400 pixels. Other resolutions: 320 × 213 pixels | 640 × 427 pixels | 1,024 × 683 pixels | 1,280 × 853 pixels | 2,560 × 1,707 pixels.
Original file (SVG file, nominally 600 × 400 pixels, file size: 10 KB)
Captions
Captions
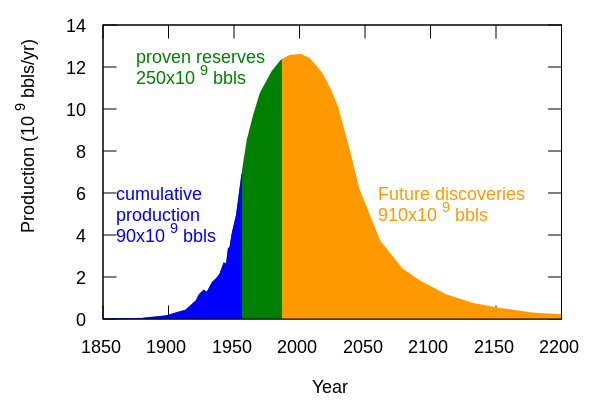
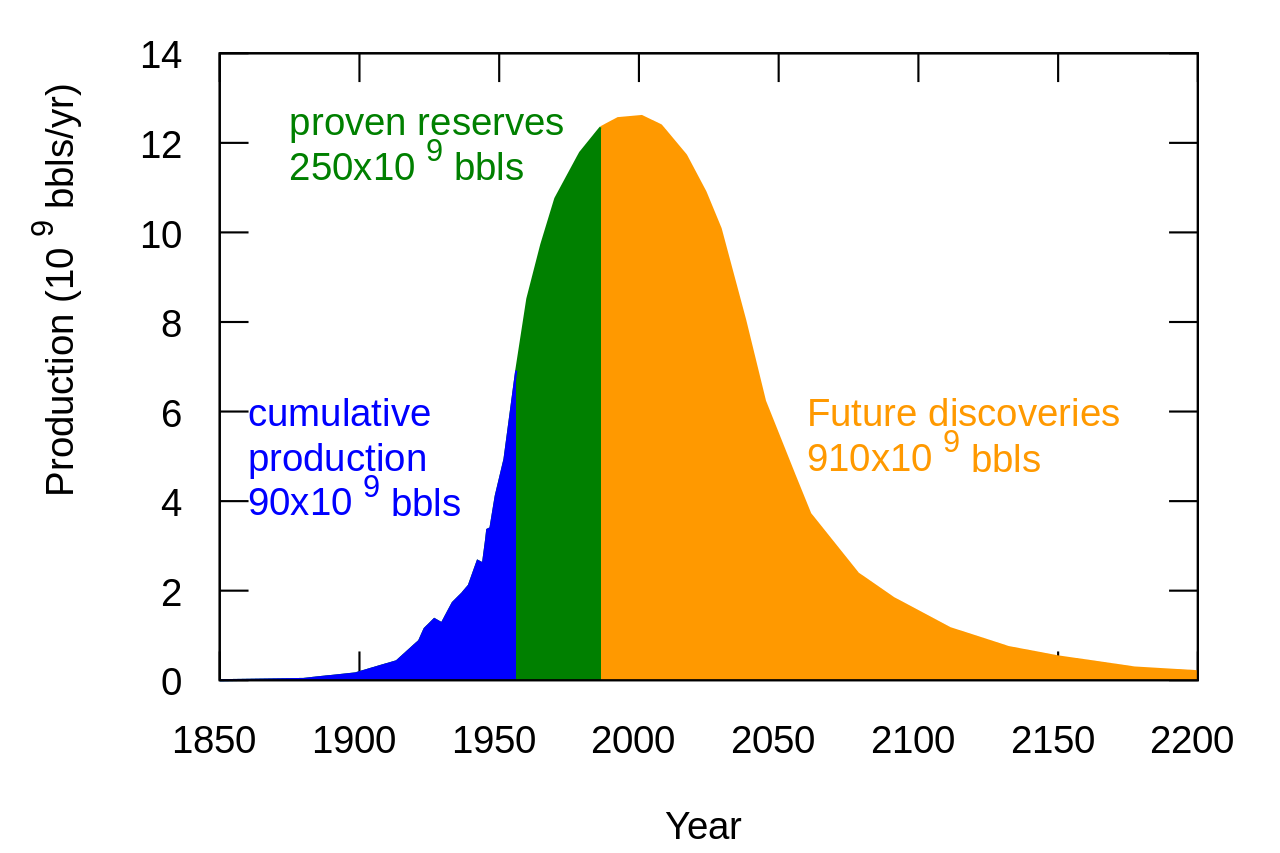
A 1956 world oil production distribution, showing historical data and future production, proposed by M. King Hubbert
Summary
[edit]| Description |
English: New presentation of data in figure 20 of http://www.hubbertpeak.com/hubbert/1956/1956.pdf . Meant as replacement for non-free en:Image:Hubbert-fig-20.png. That ["Hubbert-fig-20.png"] image file -- (well, the "image" part of it) -- has been deleted; but anyone who is interested in seeing what it looked like when it 'did' contain the non-free image (which no longer resides on any "wikimedia dot org" web sites) can [feel free to] see the "archived" copy (as of '20100531145034') (that is, as of May 31, 2010 at 14:50:34), on the Wayback Machine web site at this URL. Just "FYI". |
| Date | 4 March 2007 (original upload date) |
| Source | Transferred from en.wikipedia to Commons by Pline using CommonsHelper. |
| Author | Hankwang at English Wikipedia |
| Other versions |
|


|
This SVG file contains embedded text that can be translated into your language, using any capable SVG editor, text editor or the SVG Translate tool. For more information see: About translating SVG files. |
Licensing
[edit]
Hankwang at English Wikipedia, the copyright holder of this work, hereby publishes it under the following licenses:

|
Permission is granted to copy, distribute and/or modify this document under the terms of the GNU Free Documentation License, Version 1.2 or any later version published by the Free Software Foundation; with no Invariant Sections, no Front-Cover Texts, and no Back-Cover Texts. A copy of the license is included in the section entitled GNU Free Documentation License. |
| This file is licensed under the Creative Commons Attribution-Share Alike 3.0 Unported license. | ||
| Attribution: Hankwang at English Wikipedia | ||
| ||
| This licensing tag was added to this file as part of the GFDL licensing update. |
This file is licensed under the Creative Commons Attribution 2.5 Generic license.
Attribution: Hankwang at English Wikipedia
- You are free:
- to share – to copy, distribute and transmit the work
- to remix – to adapt the work
- Under the following conditions:
- attribution – You must give appropriate credit, provide a link to the license, and indicate if changes were made. You may do so in any reasonable manner, but not in any way that suggests the licensor endorses you or your use.
You may select the license of your choice.
Data
[edit]
Data file "hcurve.dat"
1850 0
1879.97 0.0273319
1898.53 0.150325
1913.26 0.423644
1921.36 0.881453
1923.28 1.14794
1926.76 1.36659
1929.46 1.27093
1933.38 1.72874
1936.78 1.94056
1939.13 2.11822
1942.27 2.66486
1944.19 2.60336
1945.32 3.15
1945.76 3.36182
1946.89 3.39599
1948.81 4.12028
1951.94 4.94024
1956.12 6.91497
1960.04 8.52072
1965.01 9.72332
1970.06 10.7551
1978.95 11.78
1986 12.33  # 12.35
1986.36 12.35  # 12.3608
1992.54 12.55  # 12.6
2001 12.6
2007.97 12.3882
2016.85 11.7254
2023.82 10.9054
2029.23 10.0855
2038.11 8.02191
2045.08 6.23167
2055.54 4.59859
2061.29 3.71714
2078.37 2.38471
2091.09 1.83807
2111.21 1.16844
2132.13 0.744794
2149.81 0.532972
2177.26 0.286985
2200 0.198156
Gnuplot script
set xlab 'Year'
set ylab 'Production (10^9 bbls/yr)    '
set nogrid
unset key

set label 2 'cumulative' at 1860,6  textcolor lt 3
set label 3 'production' at 1860,5  textcolor lt 3
set label 1 '90x10^9 bbls' at 1860,4  textcolor lt 3
set label 4 '250x10^9 bbls' at 1875,11.5  textcolor lt  2
set label 5 'proven reserves' at 1875,12.5  textcolor lt 2
set label 6 'Future discoveries' at 2060,6 textcolor lt 7
set label 7 '910x10^9 bbls' at 2060,5 textcolor lt 7

set term svg size 600 400 fsize 18 enhanced
set outp 'Hubbert_peak_oil_plot.svg'
plot \
  'hcurve.dat' usi ($1>=1986.36?$1:1/0):2 wi filledcurves y1=0 lt 7, \
  'hcurve.dat' usi ($1<=1986.36?$1:1/0):2 wi filledcurves y1=0, \
  'hcurve.dat' usi ($1<1956.5?$1:1/0):2 wi filledcurves y1=0
Original upload log
[edit]
The original description page was here. All following user names refer to en.wikipedia.
- 2007-03-04 12:57 Hankwang 600×400×0 (7794 bytes) New presentation of data in figure 20 of http://www.hubbertpeak.com/hubbert/1956/1956.pdf
File history
Click on a date/time to view the file as it appeared at that time.
| Date/Time | Thumbnail | Dimensions | User | Comment | |
|---|---|---|---|---|---|
| current | 14:35, 11 January 2009 | | 600 × 400 (10 KB) | Hankwang (talk | contribs) | Update after comments - Same license as before |
| 16:56, 11 June 2008 |  | 600 × 400 (8 KB) | File Upload Bot (Magnus Manske) (talk | contribs) | {{BotMoveToCommons|en.wikipedia}} {{Information |Description={{en|New presentation of data in figure 20 of http://www.hubbertpeak.com/hubbert/1956/1956.pdf . Meant as replacement for non-free en::Image:Hubbert-fig-20.png. == Data == Data file "hcu |
You cannot overwrite this file.
File usage on Commons
The following 2 pages use this file:
File usage on other wikis
The following other wikis use this file:
- Usage on ar.wikipedia.org
- Usage on ca.wikipedia.org
- Usage on de.wikipedia.org
- Usage on el.wikipedia.org
- Usage on en.wikipedia.org
- Green Revolution
- Simple living
- Energy crisis
- Roscoe Bartlett
- M. King Hubbert
- Vern Ehlers
- Hubbert peak theory
- Kenneth Hsu
- Peak oil
- David Goodstein
- Petroleum politics
- James Howard Kunstler
- Kenneth S. Deffeyes
- Colin Campbell (geologist)
- 2000s energy crisis
- Richard Heinberg
- The End of Suburbia
- The Party's Over: Oil, War, and the Fate of Industrial Societies
- Julian Darley
- Michael Klare
- Matthew Simmons
- The Long Emergency
- Hirsch report
- Oil depletion
- Rimini protocol
- Arctic Refuge drilling controversy
- Oil Shockwave
- Robert L. Hirsch
- Albert Allen Bartlett
- Ali Morteza Samsam Bakhtiari
- Energy supply
- Richard Rainwater
- Jean Laherrère
- The Power of Community: How Cuba Survived Peak Oil
- Andrew McNamara
- Energy descent
- The Carbon War
- Jeremy Leggett
- A Crude Awakening: The Oil Crash
- Oil Depletion Analysis Centre
- User:Kgrr/Sandbox/Peak oil
- Fossil fuel phase-out
- User:Hankwang/Images
- Export Land Model
- What a Way to Go: Life at the End of Empire
View more global usage of this file.