File:How superheterodyne receiver works-ru.svg
Jump to navigation
Jump to search

Size of this PNG preview of this SVG file: 597 × 600 pixels. Other resolutions: 239 × 240 pixels | 478 × 480 pixels | 765 × 768 pixels | 1,020 × 1,024 pixels | 2,039 × 2,048 pixels | 939 × 943 pixels.
Original file (SVG file, nominally 939 × 943 pixels, file size: 3 KB)
Captions
Captions
Add a one-line explanation of what this file represents
Summary
[edit]| Description |
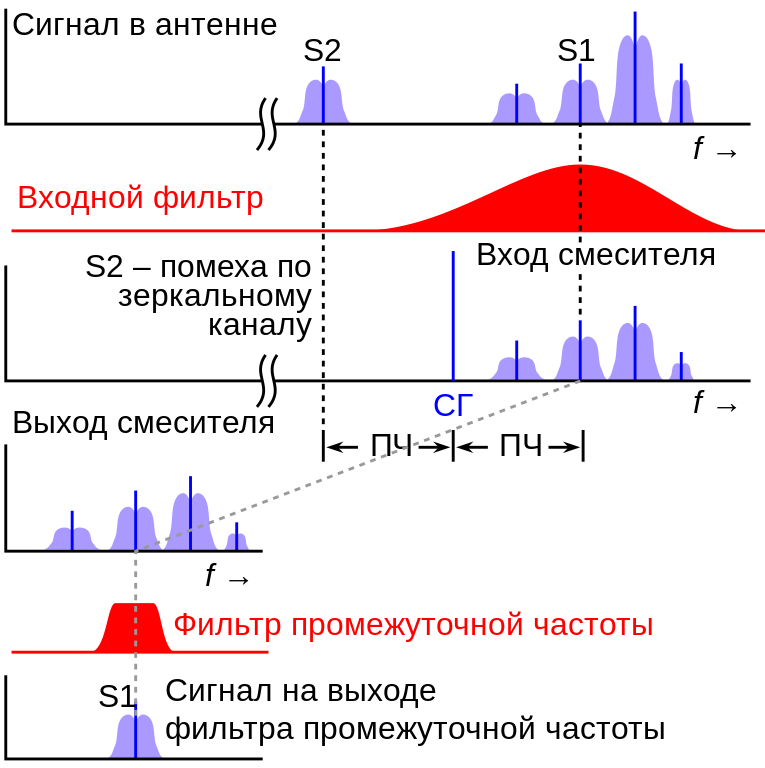
English: Graphs showing how a superheterodyne| radio receiver works. All the graphs horizontal axis is frequency f. The blue graphs represent signal strength (voltage) at various point in the circuit. The red graphs are the transfer functions of the filters; the width of the red band represents the fraction of the signal from the graph above it that passes through the filter at various frequencies. The top graph shows the voltage from the antenna applied to the receiver. It is a composite of signals (blue shapes) from several radio transmitters at different frequencies. Signal S1 is the signal received by the radio. Each signal consists of the carrier frequency (dark blue vertical line) with sidebands on either side containing the modulation (light blue bands). The signal first passes through the RF filter. Its purpose is to remove any signal such as S2 at the image frequency, LO - IF, which would otherwise interfere with the received signal. The 3rd graph shows the signals applied to the mixer, consisting of the local oscillator signal LO and the four radio signals. In the mixer the LO signal beats with the four signals, creating heterodynes at the difference between the signal frequency and the LO frequency. The 4th graph shows these heterodynes. The IF filter (5th graph) selects the frequency of the desired signal, S1 and filters out the others, along with unwanted modulation products
Русский: Графики пояснияющие принцип преобразования частоты и прохождение сигнала в супергетеродином радиоприёмнике. По горизонтальной оси всех графиков отложена частота f. Синие графики представляют уровень сигнала (напряжение) в различных участках радиоприёмника. Красные графики — передаточные функции фильтров; ширина красной полосы представляет коэффициент передачи на различных частотах. На верхнем графике показано напряжение от антенны, подаваемое на приемник. Это комбинация сигналов (светло-синие фигуры) от нескольких радиопередатчиков на разных частотах. Сигнал S1 — это принимаемый сигнал. Каждый сигнал состоит из несущей частоты (темно-синяя вертикальная линия) с боковыми полосами по обе стороны от неё (голубые полосы). Вначале сигнал от антенны проходит через ВЧ-фильтр. Его назначение — ослабить любой сигнал, например, S2 с зеркальной частотой, равной разности частоты гетеродина и промежуточной частоты (ПЧ), который без принятия мер для его подавления создавал бы помехи для принимаемого сигнала. На третьем графике показаны сигналы, подаваемые на смеситель, состоящие из сигнала гетеродина и четырех радиосигналов. В смесителе сигнал гетеродина (СГ) испытывает биения с четырьмя сигналами, порождая разностные частоты между частотами сигналов и частотой гетеродина. На 4-м графике показаны эти разностные частоты. Фильтр ПЧ (5-й график) выбирает частоту полезного сигнала S1 (6-й график) и блокирует остальные частоты вместе с мешающими комбинационными частотами. |
| Date | |
| Source | File:How superheterodyne receiver works.svg by Chetvorno |
| Author | Д.Ильин: translation, optimization |
| Other versions |
|


This vector image was created with Inkscape by v .

|
This SVG file contains embedded text that can be translated into your language, using any capable SVG editor, text editor or the SVG Translate tool. For more information see: About translating SVG files. |
Licensing
[edit]
I, the copyright holder of this work, hereby publish it under the following license:
| This file is made available under the Creative Commons CC0 1.0 Universal Public Domain Dedication. | |
| The person who associated a work with this deed has dedicated the work to the public domain by waiving all of their rights to the work worldwide under copyright law, including all related and neighboring rights, to the extent allowed by law. You can copy, modify, distribute and perform the work, even for commercial purposes, all without asking permission.
|
File history
Click on a date/time to view the file as it appeared at that time.
| Date/Time | Thumbnail | Dimensions | User | Comment | |
|---|---|---|---|---|---|
| current | 22:23, 7 May 2023 | | 939 × 943 (3 KB) | Д.Ильин (talk | contribs) | Reducing signals after the input filter |
| 20:45, 4 May 2023 |  | 939 × 943 (3 KB) | Д.Ильин (talk | contribs) |
You cannot overwrite this file.
File usage on Commons
The following 4 pages use this file:
File usage on other wikis
The following other wikis use this file:
- Usage on ru.wikipedia.org