File:HighSensitivity LowSpecificity cs.png
Jump to navigation
Jump to search
Size of this preview: 800 × 600 pixels. Other resolutions: 320 × 240 pixels | 640 × 480 pixels | 1,024 × 767 pixels | 1,280 × 959 pixels | 1,401 × 1,050 pixels.
Original file (1,401 × 1,050 pixels, file size: 54 KB, MIME type: image/png)
Captions
Captions
Add a one-line explanation of what this file represents
| Description |
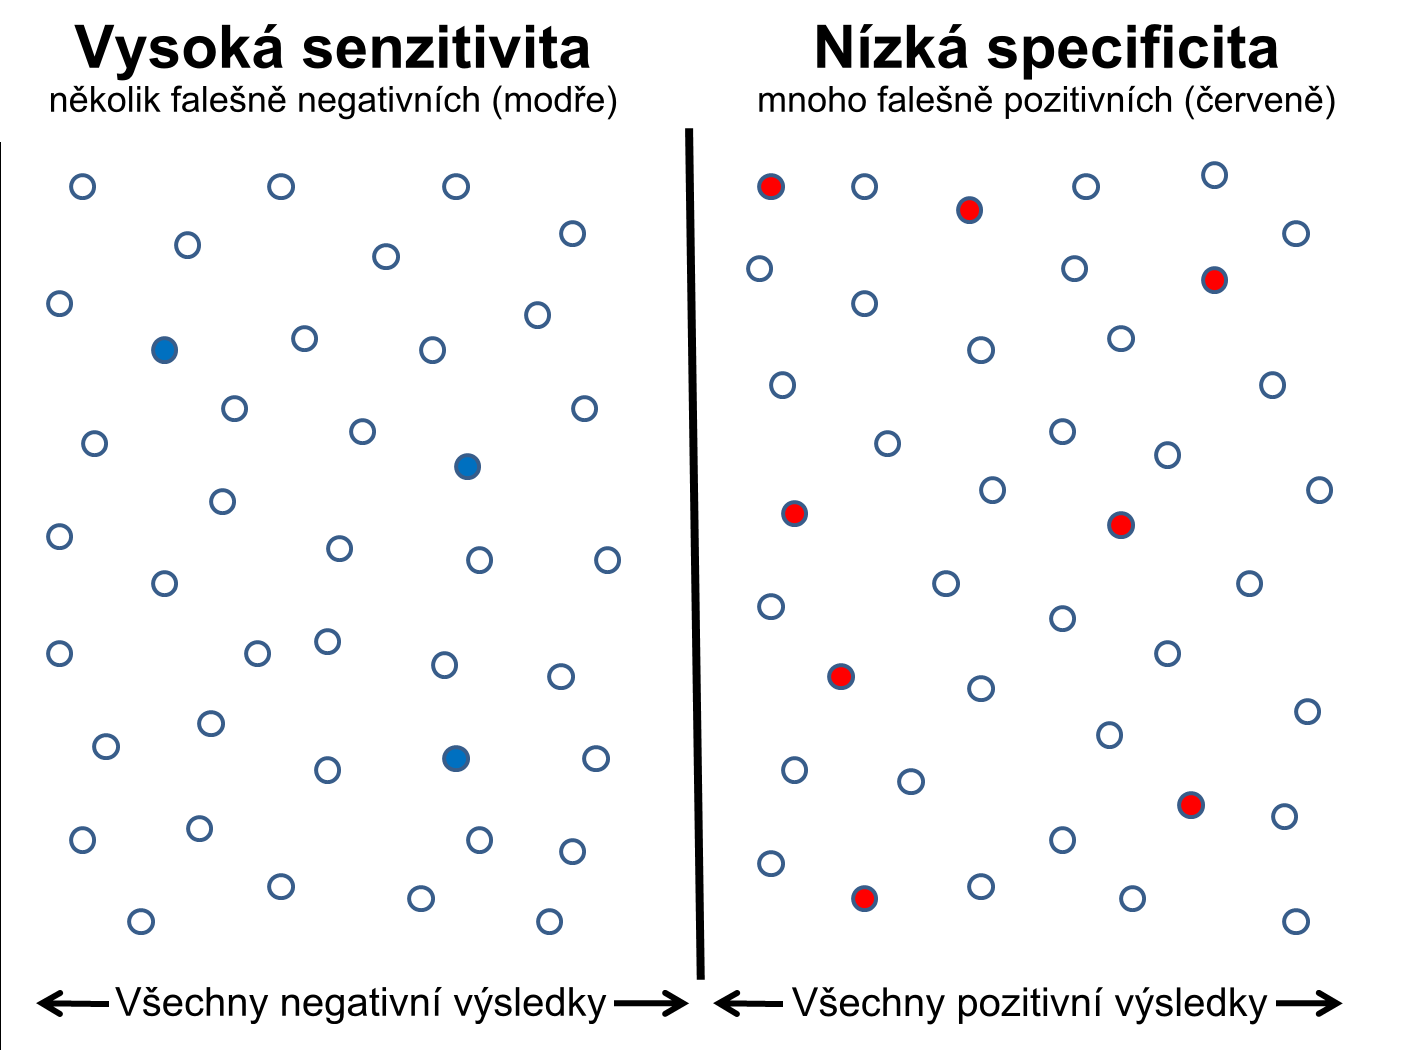
English: Graphical illustration of high sensitivity and low specificity. Each data point is represented by a circle. Data which failed the test are drawn on the left side of the vertical bar and data which passed the test are drawn on the right side of the vertical bar. False negatives are shown as closed blue circles in the left panel and false positives are shown as closed red circles in the right panel. All other data points (open circles) are either true negatives (on the left) or true positives (on the right). |
| Date | (UTC) |
| Source | |
| Author |
|
| Other versions |
[]
|


| This is a retouched picture, which means that it has been digitally altered from its original version. Modifications: Czech translation. The original can be viewed here: HighSensitivity LowSpecificity 1401x1050.png:
|
I, the copyright holder of this work, hereby publish it under the following license:
| This file is made available under the Creative Commons CC0 1.0 Universal Public Domain Dedication. | |
| The person who associated a work with this deed has dedicated the work to the public domain by waiving all of their rights to the work worldwide under copyright law, including all related and neighboring rights, to the extent allowed by law. You can copy, modify, distribute and perform the work, even for commercial purposes, all without asking permission.
|
Original upload log
[edit]
This image is a derivative work of the following images:
- File:HighSensitivity_LowSpecificity_1401x1050.png licensed with Cc-zero
- 2011-03-06T21:55:15Z Rmostell 1401x1050 (79016 Bytes) {{Information |Description ={{en|1=Graphical illustration of high sensitivity and low specificity. Each data point is represented by a circle. Data which failed the test are drawn on the left side of the vertical bar and
Uploaded with derivativeFX
File history
Click on a date/time to view the file as it appeared at that time.
| Date/Time | Thumbnail | Dimensions | User | Comment | |
|---|---|---|---|---|---|
| current | 15:52, 28 April 2011 | | 1,401 × 1,050 (54 KB) | Icewalker cs (talk | contribs) | Translation correction |
| 18:21, 27 April 2011 |  | 1,401 × 1,050 (53 KB) | Icewalker cs (talk | contribs) | {{Information |Description={{en|1=Graphical illustration of high sensitivity and low specificity. Each data point is represented by a circle. Data which failed the test are drawn on the left side of the vertical bar and data which passed the test are dra |
You cannot overwrite this file.
File usage on Commons
The following 4 pages use this file: