File:GevDensity.svg
Jump to navigation
Jump to search

Size of this PNG preview of this SVG file: 600 × 600 pixels. Other resolutions: 240 × 240 pixels | 480 × 480 pixels | 768 × 768 pixels | 1,024 × 1,024 pixels | 2,048 × 2,048 pixels | 630 × 630 pixels.
Original file (SVG file, nominally 630 × 630 pixels, file size: 116 KB)
Captions
Captions
Add a one-line explanation of what this file represents
Summary
[edit]| Description |
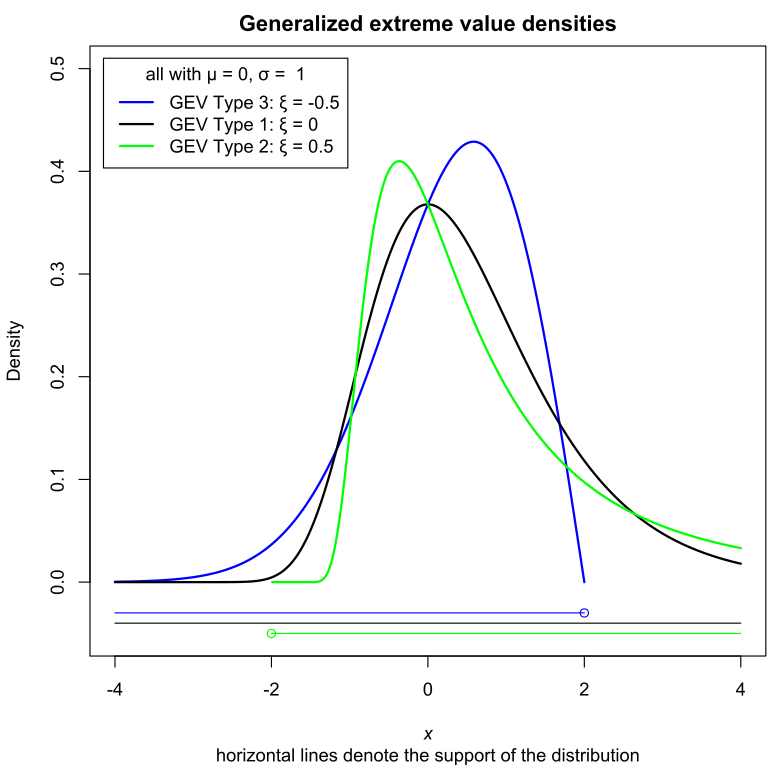
English: Densities of the Generalized Extreme Value (GEV) Distribution for several shape parameters Deutsch: Dichtefunktion der Generalisierten Extremwertverteilung (GEV) für unterschiedliche Formparameter |
| Date | |
| Source | Own work based on: GevDensity 2.svg |
| Author |
|
| Other versions |
|
| SVG development | |
| Source code | R codedgev <- function(x, loc = 0, scale = 1, shape = 0){
t1 <- if(shape == 0) {
exp(-(x - loc)/scale)
} else {
(1 + shape * (x - loc)/scale )^(-1/shape)
}
d <- 1/scale * t1^(shape + 1) * exp(-t1)
# setting desity to NA outside of range
outside <- numeric()
if(shape < 0) outside <- x > loc - scale/shape
if(shape > 0) outside <- x < loc - scale/shape
d[outside] <- NA
return(d)
}
draw_support <- function(y, loc = 0, scale = 1, shape = 0, ...) {
if (shape == 0) segments(x0 = par("xaxp")[1], x1 = par("xaxp")[2], y0 = y, ...)
end <- loc - scale/shape
if (shape < 0) segments(x0 = par("xaxp")[1], x1 = end, y0 = y, ...)
if (shape > 0) segments(x0 = end, x1 = par("xaxp")[2], y0 = y, ...)
points(x = end, y = y, pch = 21, ...)
}
x <- seq(-4, 4, 0.01)
shape <- c("3" = -0.5, "1" = 0, "2" = 0.5)
col <- c("blue", "black", "green")
prob <- seq(0, 1, 0.001)
svg("GevDensity.svg")
par(mar = c(5, 4, 2, 0) + 0.1)
plot(NA, xlim=range(x), ylim=c(-0.05, 0.5), type = "n",
xlab = expression(italic(x)), ylab = "Density",
main = "Generalized extreme value densities",
sub = "horizontal lines denote the support of the distribution")
for(i in seq_along(shape)) {
lines(x, dgev(x, shape = shape[i]), col=col[i], lwd = 2)
draw_support(shape = shape[i], col=col[i], y = -i/100 -0.02 )
}
legend("topleft", lwd = 2, col = col, inset = 0.02,
title = "all with \u03bc = 0, \u03c3 = 1",
legend = paste0("GEV Type ", names(shape), ": \u03be = ", shape))
dev.off()
|

Licensing
[edit]
I, the copyright holder of this work, hereby publish it under the following license:
This file is licensed under the Creative Commons Attribution-Share Alike 4.0 International license.
- You are free:
- to share – to copy, distribute and transmit the work
- to remix – to adapt the work
- Under the following conditions:
- attribution – You must give appropriate credit, provide a link to the license, and indicate if changes were made. You may do so in any reasonable manner, but not in any way that suggests the licensor endorses you or your use.
- share alike – If you remix, transform, or build upon the material, you must distribute your contributions under the same or compatible license as the original.
File history
Click on a date/time to view the file as it appeared at that time.
| Date/Time | Thumbnail | Dimensions | User | Comment | |
|---|---|---|---|---|---|
| current | 15:06, 5 August 2015 | | 630 × 630 (116 KB) | T.gauster (talk | contribs) | User created page with UploadWizard |
You cannot overwrite this file.
File usage on Commons
The following page uses this file:
File usage on other wikis
The following other wikis use this file:
- Usage on fa.wikipedia.org