File:GMCdiagram.jpg
Original file (1,506 × 687 pixels, file size: 264 KB, MIME type: image/jpeg)
Captions
Captions
Summary
[edit]
| Description |
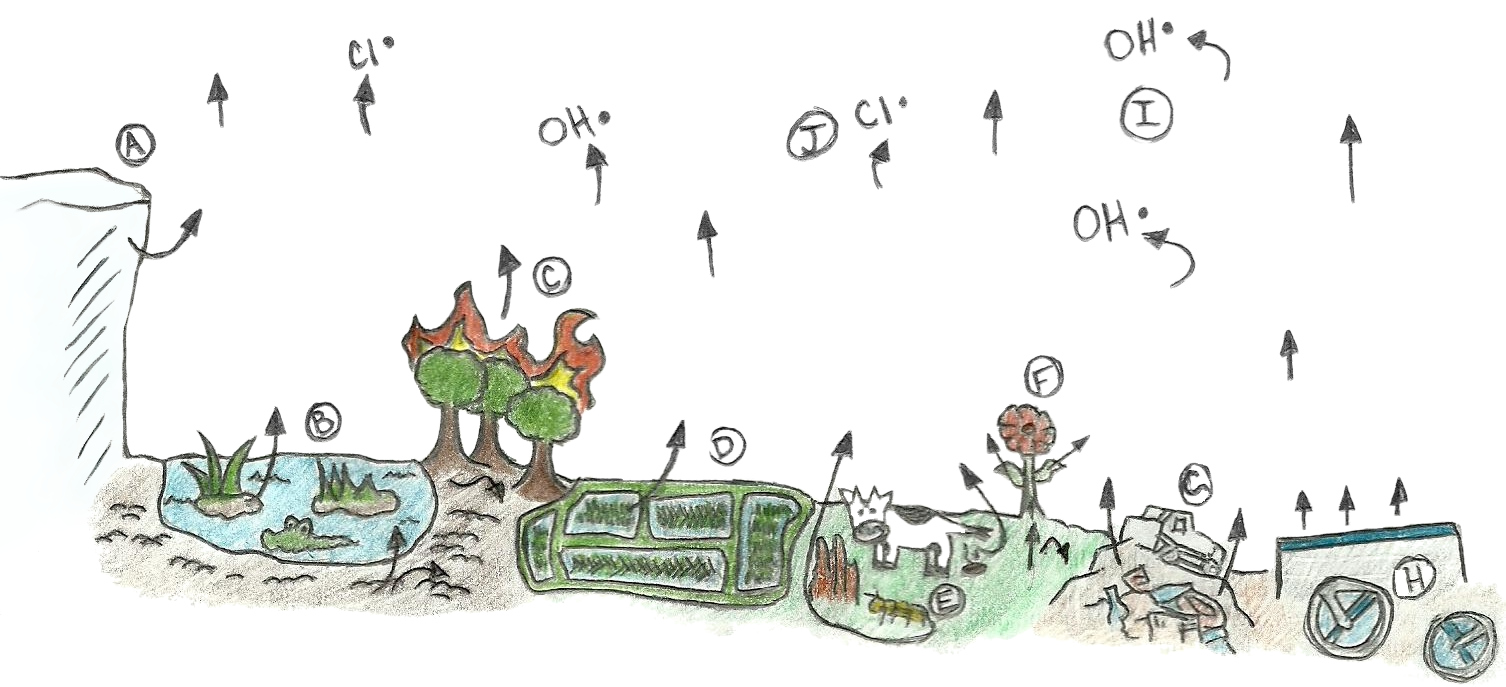
English: This diagram depicts the flow of methane from sources into the atmosphere as well as the sinks that consume methane.
A. Permafrost, Glaciers, and Ice Cores – A source that slowly releases methane trapped in frozen environments as global temperatures rise B. Wetlands – Warm temperatures and moist environments are ideal for methane production. Most of the methane makes it past methane-consuming microorganisms. C. Forest Fires – Mass burning of organic matter releases huge amounts of methane into the atmosphere. D. Rice Paddies – The warmer and moister the rice field, the more methane is produced. E. Animals – Microorganisms breaking down difficult to digest material in the guts of ruminant livestock and termites produce methane that is then released during defecation. F. Plants – While methane can be consumed in soil before being released into the atmosphere, plants allow for direct travel of methane up through the roots and leaves and into the atmosphere. Plants may also be direct producers of methane. G. Landfills – Decaying organic matter and anaerobic conditions cause landfills to be a significant source of methane. H. Waste Water Treatment Facilities – Anaerobic treatment of organic compounds in the water results in the production of methane. I. Hydroxyl Radical – OH in the atmosphere is the largest sink for atmospheric methane as well as one of the most significant sources of water vapor in the upper atmosphere. J. Chlorine Radical – Free chlorine in the atmosphere also reacts with methane. |
| Date | |
| Source | Own work |
| Author | Olivia Shoup |
Licensing
[edit]
- You are free:
- to share – to copy, distribute and transmit the work
- to remix – to adapt the work
- Under the following conditions:
- attribution – You must give appropriate credit, provide a link to the license, and indicate if changes were made. You may do so in any reasonable manner, but not in any way that suggests the licensor endorses you or your use.
- share alike – If you remix, transform, or build upon the material, you must distribute your contributions under the same or compatible license as the original.

|
Permission is granted to copy, distribute and/or modify this document under the terms of the GNU Free Documentation License, Version 1.2 or any later version published by the Free Software Foundation; with no Invariant Sections, no Front-Cover Texts, and no Back-Cover Texts. A copy of the license is included in the section entitled GNU Free Documentation License. |
File history
Click on a date/time to view the file as it appeared at that time.
| Date/Time | Thumbnail | Dimensions | User | Comment | |
|---|---|---|---|---|---|
| current | 06:32, 8 April 2016 | | 1,506 × 687 (264 KB) | AkselA (talk | contribs) | Cleaned up somewhat |
| 06:50, 20 November 2013 |  | 1,506 × 687 (240 KB) | Bobamnertiopsis (talk | contribs) | cropped | |
| 18:45, 27 February 2011 |  | 1,507 × 710 (133 KB) | OSJVFCO301 (talk | contribs) | {{Information |Description ={{en|1=This diagram depicts the flow of methane from sources into the atmosphere as well as the sinks that consume methane. A. Permafrost, Glaciers, and Ice Cores – A source that slowly releases methane trapped in frozen |
You cannot overwrite this file.
File usage on Commons
There are no pages that use this file.
File usage on other wikis
The following other wikis use this file:
- Usage on el.wikipedia.org
- Usage on fa.wikipedia.org
- Usage on gl.wikipedia.org