File:Fst of Brazilians and Mexicans - Distribution.png
Jump to navigation
Jump to search

Size of this preview: 672 × 600 pixels. Other resolutions: 269 × 240 pixels | 538 × 480 pixels | 860 × 768 pixels | 1,147 × 1,024 pixels | 2,294 × 2,048 pixels | 4,816 × 4,300 pixels.
Original file (4,816 × 4,300 pixels, file size: 935 KB, MIME type: image/png)
Captions
Captions
Add a one-line explanation of what this file represents
| Description |
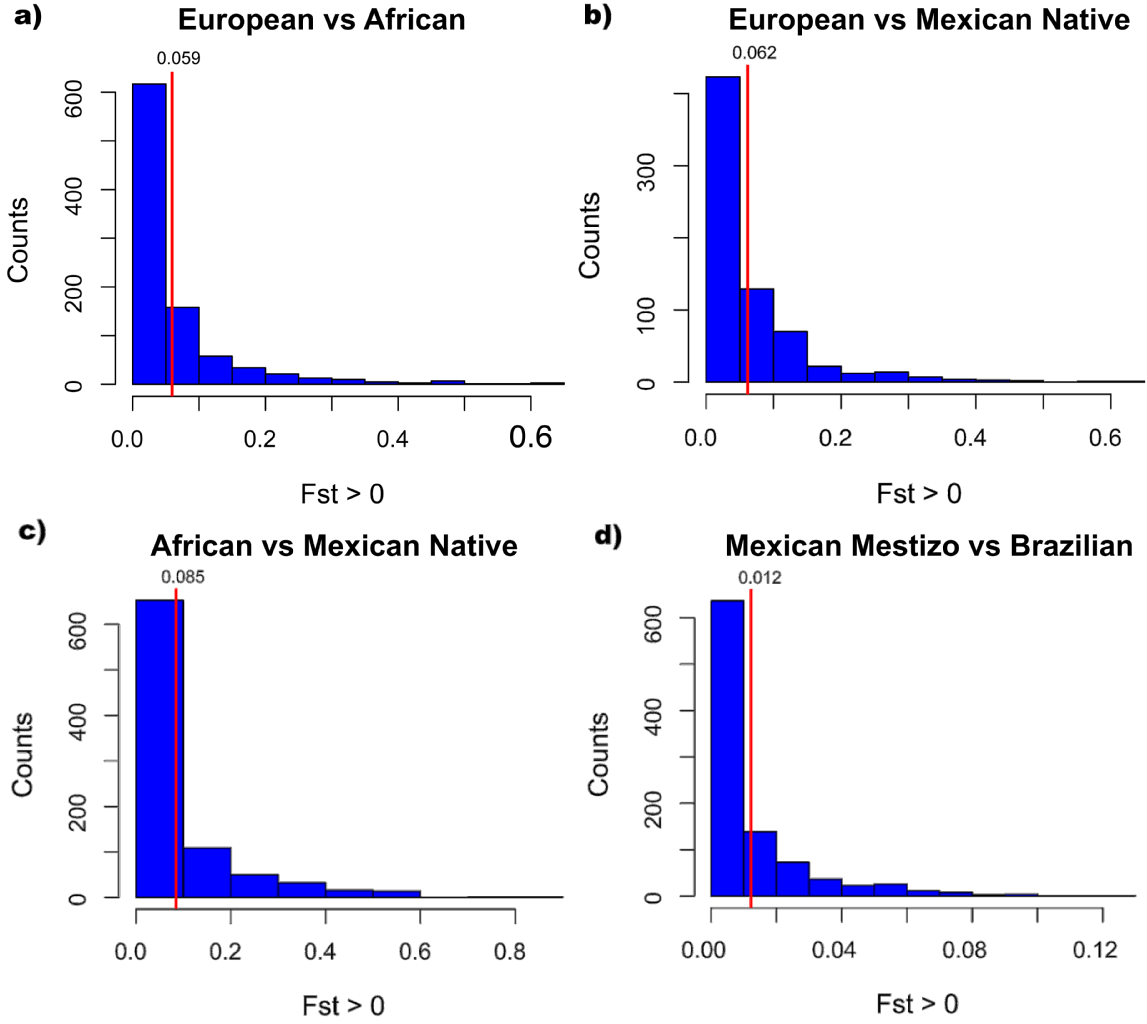
English: Distribution of FST values. Pairwise comparisons were done for the three ancestral populations and for the admixed populations Mexico and Brazil, a) Europe vs Africa; b) Europe vs Native American; c) Africa vs Native American; and d) Mexico vs Brazil.
The figure shows the distribution of FST values for all the pairwise comparisons in a graphical format. The average FST values are low, indicating reduced genetic differentiation. However, it is important to note the broad distribution of FST values. While most of the genetic markers have low genetic differentiation, there are many outliers with high FST values. The highest average FST values are observed between the African and the Native American samples (FST = 0.085). The FST values observed for the African-European and European-Native American comparisons were 0.059 and 0.062, respectively. The average genetic differentiation between the Brazilian and Mexican samples with respect to the parental samples is lower than the genetic differentiation observed between the parental samples (FST = 0.012), as expected given the history of admixture in Brazil and Mexico. |
| Date | Published: November 24, 2014 |
| Source | Bonifaz-Peña V, Contreras AV, Struchiner CJ, Roela RA, Furuya-Mazzotti TK, Chammas R, et al. (2014) Exploring the Distribution of Genetic Markers of Pharmacogenomics Relevance in Brazilian and Mexican Populations. PLoS ONE 9(11): e112640. doi:10.1371/journal.pone.0112640 http://journals.plos.org/plosone/article?id=10.1371/journal.pone.0112640 |
| Author | Vania Bonifaz-Peña, Alejandra V. Contreras, Claudio Jose Struchiner, Rosimeire A. Roela, Tatiane K. Furuya-Mazzotti, Roger Chammas, Claudia Rangel-Escareño, Laura Uribe-Figueroa, María José Gómez-Vázquez, Howard L. McLeod, Alfredo Hidalgo-Miranda, Esteban J. Parra , Juan Carlos Fernández-López , Guilherme Suarez-Kurtz |
| Other versions |
   |
|
This file is licensed under the Creative Commons Attribution 2.5 Generic license.
|
This file was published in a Public Library of Science journal. Their website states that the content of all PLOS journals is published under the Creative Commons Attribution 4.0 license (or its previous version depending on the publication date), unless indicated otherwise.
|
File history
Click on a date/time to view the file as it appeared at that time.
| Date/Time | Thumbnail | Dimensions | User | Comment | |
|---|---|---|---|---|---|
| current | 10:55, 27 November 2016 | | 4,816 × 4,300 (935 KB) | Was a bee (talk | contribs) | {{Information |Description={{en|1= Distribution of F<sub>ST</sub> values. Pairwise comparisons were done for the three ancestral populations and for the admixed populations Mexico and Brazil, a) Europe vs Africa; b) Europe vs Native American; c) Africa... |
You cannot overwrite this file.
File usage on Commons
The following 3 pages use this file: