File:Fpls-02-00029-a005.png
Jump to navigation
Jump to search
Size of this preview: 800 × 551 pixels. Other resolutions: 320 × 220 pixels | 640 × 441 pixels | 1,024 × 705 pixels | 1,417 × 976 pixels.
Original file (1,417 × 976 pixels, file size: 60 KB, MIME type: image/png)
Captions
Captions
Add a one-line explanation of what this file represents
Summary
[edit]
| Description |
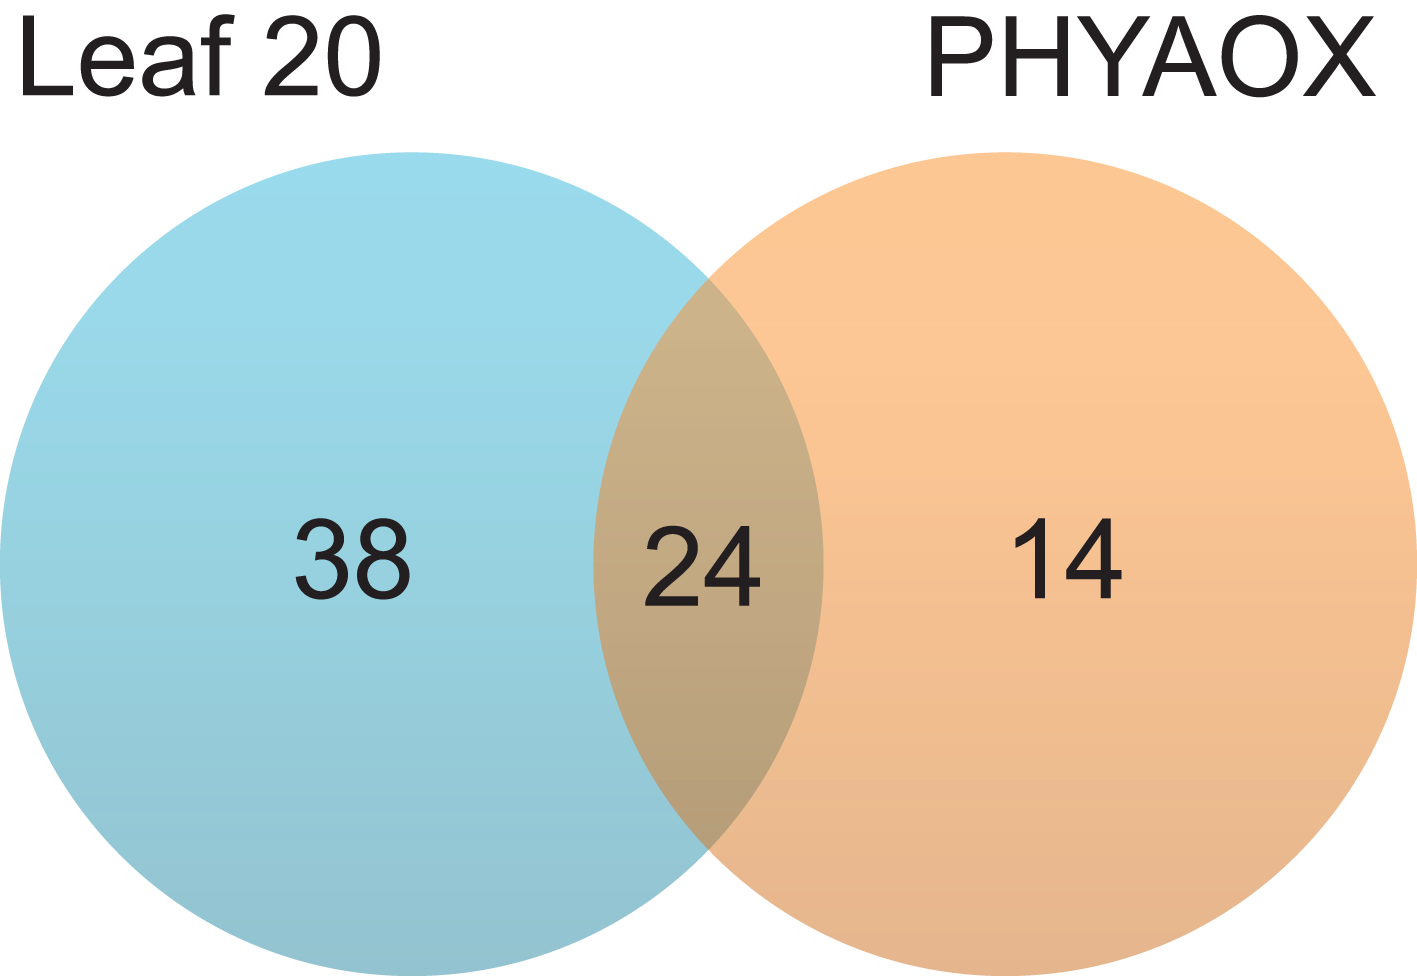
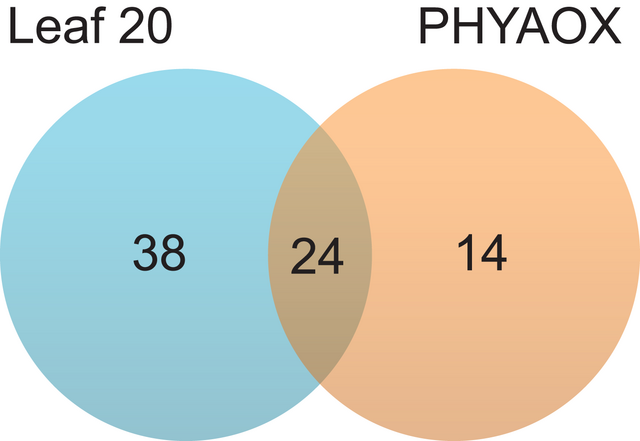
English: The Venn diagram of known metabolites found as age-dependent (left) and genotype-dependent (right) metabolites in each dataset as determined by ANOVA. The number in the left-hand circle represents how many metabolites showed significant changes according to age-dependent differences. The number in the right-hand circle represents the number of significant metabolites with respect to genotype-dependent differences. The number in the middle represents the common metabolites between age-dependent and genotype-dependent metabolites. FDR < 0.05. |
| Date | |
| Source | doi:10.3389/fpls.2011.00029 |
| Author | Miyako Kusano, Pär Jonsson, Atsushi Fukushima, Jonas Gullberg, Michael Sjöström, Johan Trygg, Thomas Moritz |
Licensing
[edit]
This file is licensed under the Creative Commons Attribution 3.0 Unported license.
- You are free:
- to share – to copy, distribute and transmit the work
- to remix – to adapt the work
- Under the following conditions:
- attribution – You must give appropriate credit, provide a link to the license, and indicate if changes were made. You may do so in any reasonable manner, but not in any way that suggests the licensor endorses you or your use.
File history
Click on a date/time to view the file as it appeared at that time.
| Date/Time | Thumbnail | Dimensions | User | Comment | |
|---|---|---|---|---|---|
| current | 08:46, 6 June 2017 | | 1,417 × 976 (60 KB) | TIB-NOA (talk | contribs) | pattypan 17.05 |
You cannot overwrite this file.
File usage on Commons
The following page uses this file: