File:Figure 19- Racial and Ethnic Composition of Postsecondary Degrees Awarded in the 2011-2012 Academic Year (14389962164).jpg
Original file (1,426 × 642 pixels, file size: 67 KB, MIME type: image/jpeg)
Captions
Captions
Summary
[edit].jpg&action=edit§ion=1)
| Description |
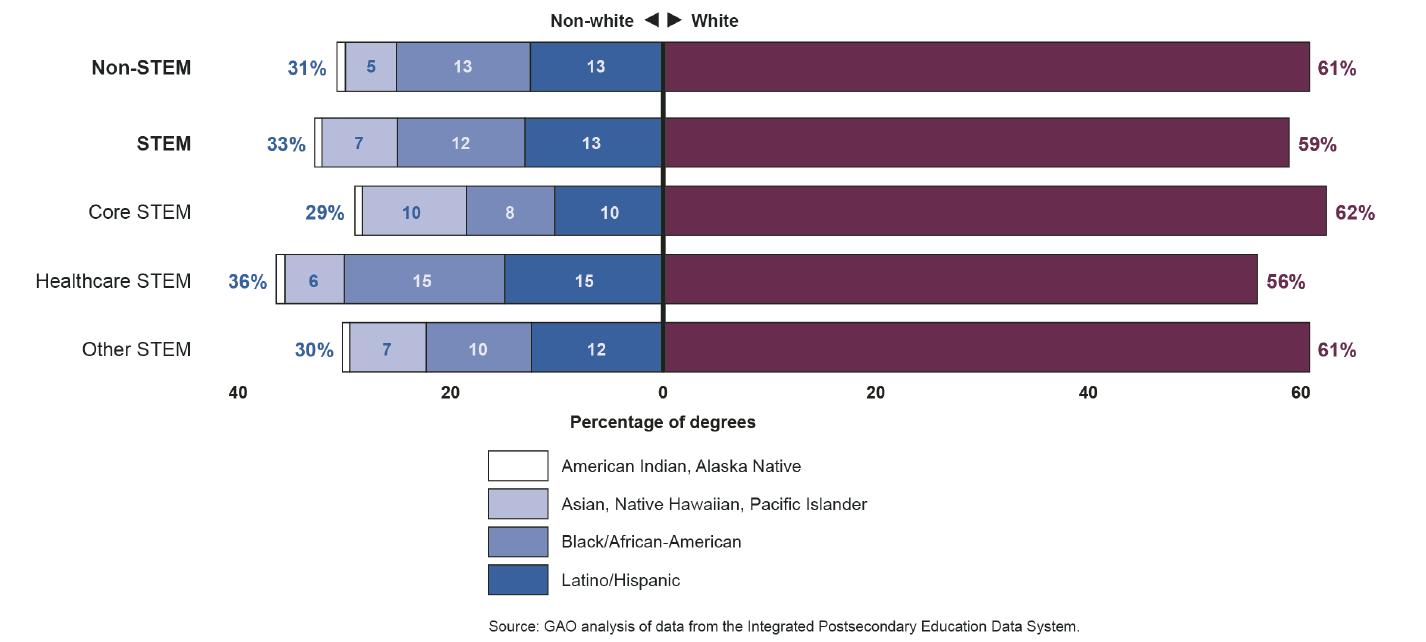
This image is excerpted from a U.S. GAO report: www.gao.gov/products/GAO-14-374 SCIENCE, TECHNOLOGY, ENGINEERING, AND MATHEMATICS EDUCATION: Assessing the Relationship between Education and the Workforce Note: This figure presents information on degrees awarded to citizens and resident aliens only. It does not include degrees awarded to non-resident aliens. Percentages for the non-white demographic groups may not total the percentages on the left of each bar due to rounding. The percentages for degrees awarded to American Indian, Alaska Native students are: 0.8 percent for non-STEM, 0.7 percent for STEM, 0.7 percent for Other STEM and Core STEM, and 0.8 percent for Healthcare. Not shown in the figure are degrees awarded to citizens and resident aliens of more than one race or of unknown race. As a result, the percentages on the left of each bar and the percentages on the right of each bar do not total 100. In the 2011-2012 academic year, degrees received by students of more than one race comprised: 1.3 percent of STEM degrees awarded to citizens and residents, 1.4 percent of non-STEM degrees, 1.4 percent of Core STEM degrees, 1.3 percent of Healthcare degrees, and 1.8 percent of Other STEM degrees. Degrees received by students whose race is unknown comprised 6.9 percent of STEM degrees awarded to citizens and resident aliens, 7.3 percent of non-STEM degrees, 7.2 percent of Core STEM degrees, 6.5 percent of Healthcare degrees, and 7.2 percent of Other STEM degrees. |
| Date | |
| Source | Figure 19: Racial and Ethnic Composition of Postsecondary Degrees Awarded in the 2011-2012 Academic Year |
| Author | U.S. Government Accountability Office from Washington, DC, United States |
Licensing
[edit].jpg&action=edit§ion=2)
| This image is a work of an employee of the Government Accountability Office or a predecessor organization, taken or made as part of that person's official duties. As a work of the U.S. federal government, the image is in the public domain in the United States. | 
|
| This image was originally posted to Flickr by U.S. GAO at https://flickr.com/photos/58220939@N03/14389962164 (archive). It was reviewed on 23 December 2017 by FlickreviewR 2 and was confirmed to be licensed under the terms of the United States Government Work. |
File history
Click on a date/time to view the file as it appeared at that time.
| Date/Time | Thumbnail | Dimensions | User | Comment | |
|---|---|---|---|---|---|
| current | 05:14, 23 December 2017 | | 1,426 × 642 (67 KB) | Artix Kreiger 2 (talk | contribs) | Transferred from Flickr via Flickr2Commons |
You cannot overwrite this file.
File usage on Commons
There are no pages that use this file.
.jpg&oldid=892175729)