File:Exponential Function (Real Part at Infinity).png
Jump to navigation
Jump to search
Size of this preview: 728 × 600 pixels. Other resolutions: 292 × 240 pixels | 583 × 480 pixels | 933 × 768 pixels | 1,244 × 1,024 pixels | 1,700 × 1,400 pixels.
Original file (1,700 × 1,400 pixels, file size: 571 KB, MIME type: image/png)
Captions
Captions
Add a one-line explanation of what this file represents
| Description |
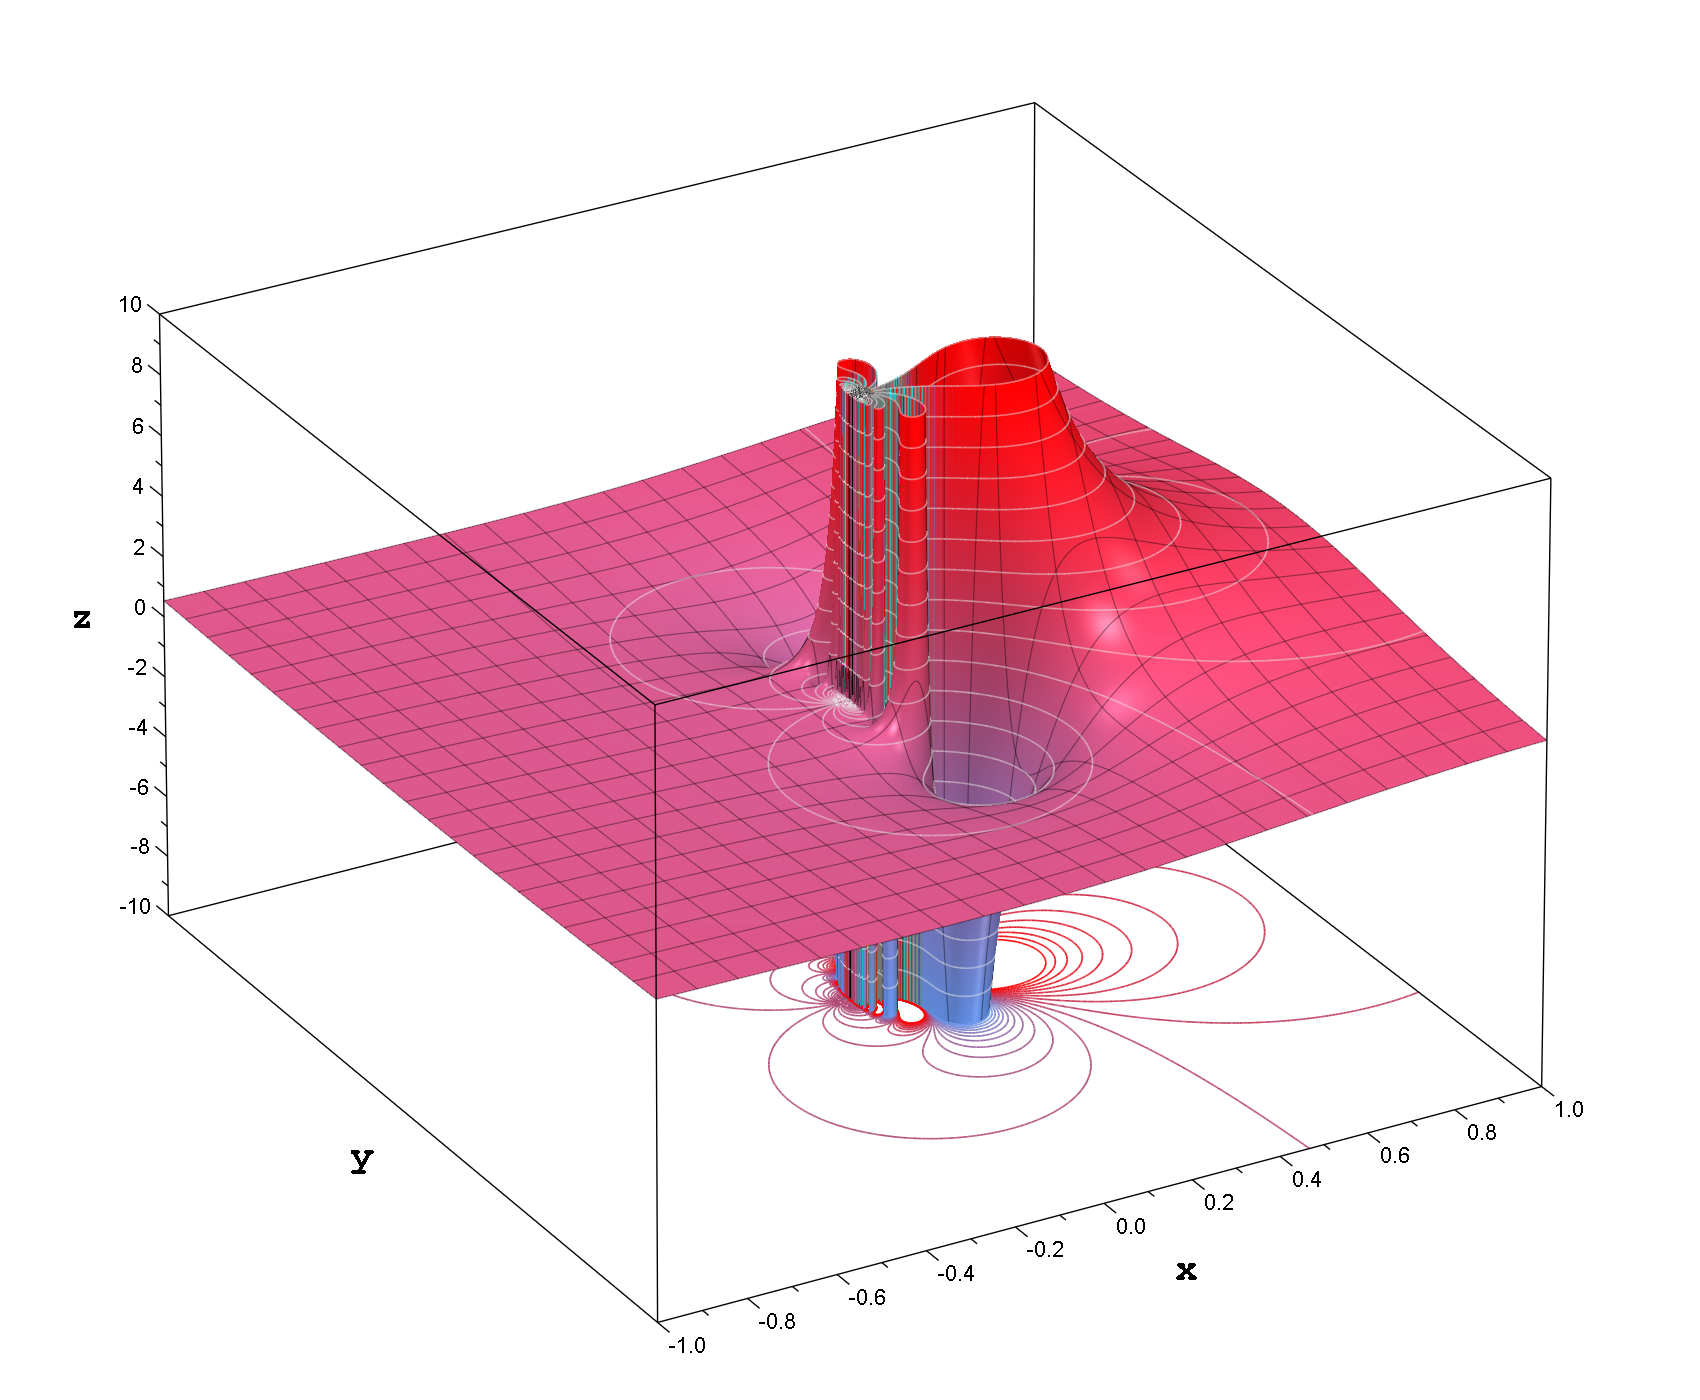
Diagram of the real part of exponetial function in the complex plane, as the operand approaches infinity. The plot is given by: |
||
| Date | |||
| Source | Own drawing, Plotted in MuPAD | ||
| Author | Inductiveload | ||
| Permission (Reusing this file) |
|

MuPAD Code
[edit].png&action=edit§ion=1)
  q := Re(exp(1/(x+I*y))):

  conts := 21:
  projectionlevel:=-10:
  ylimit := 1:
  xlimit := 1:
  submeshlevel := 30:

colourfunc := zip(RGB::Red, RGB::CornflowerBlue,
                  (a, b) -> (q(x,y)+10)/(20)*a
                           -(q(x,y)-10)/(20)*b):

funcplot := plot::Function3d(q(x,y),
                             x = -xlimit..xlimit,
                             y = -ylimit..ylimit,
                             Mesh = [23, 23],
                             Submesh = [submeshlevel,submeshlevel],
                             LineColor = RGB::Black.[0.4],
                             LineWidth = 0.15,
                             FillColorFunction = colourfunc,
                             AxesTitleFont = ["Courier New", Bold, 14],
                             ViewingBoxZRange = -10..10
                            ):

contours := plot::modify(funcplot,
                         ZContours = [Automatic, conts],
                         LineWidth = 0.2,
                         LineColor = RGB::Gray90.[0.5],
                         XLinesVisible = FALSE,
                         YLinesVisible = FALSE,
                         Filled = FALSE
                        ):

projcontours := plot::Transform3d([0, 0, projectionlevel],
                                  [1, 0, 0, 0, 1, 0, 0, 0, 0],
                                   plot::modify(funcplot, ZContours = [Automatic, conts],
                                                LineWidth = 0.2,
                                                LineColorType = Dichromatic,
                                                LineColor = RGB::Red.[0.99],
                                                LineColor2 = RGB::CornflowerBlue.[0.99],
                                                XLinesVisible = FALSE,
                                                YLinesVisible = FALSE,
                                                Filled = FALSE
                                               )
                                  ):

camera := plot::Camera([-20, -35, 300],
                       [0, 0, 0],
                       0.06
                      ):

ploteverything := plot::Canvas(funcplot, contours, projcontours,
                               Width = 8.5*unit::inch,
                               Height = 7*unit::inch,
                               camera
                              ):

plot(ploteverything)
File history
Click on a date/time to view the file as it appeared at that time.
| Date/Time | Thumbnail | Dimensions | User | Comment | |
|---|---|---|---|---|---|
| current | 01:05, 21 April 2007 | | 1,700 × 1,400 (571 KB) | Inductiveload (talk | contribs) | Change to 3D plot. |
| 00:17, 21 April 2007 |  | 850 × 700 (93 KB) | Inductiveload (talk | contribs) | ||
| 20:44, 20 April 2007 |  | 850 × 700 (108 KB) | Inductiveload (talk | contribs) | {{Information |Description=Diagram of the real part of exponetial function in the complex plane, as the operand approaches infinity. The plot is given by: ::<math>z=\operatorname{Re} \left (\exp \left( \frac{1}{x + i y} \right)\right)</math> |Source=Own d |
You cannot overwrite this file.
File usage on Commons
The following page uses this file:
File usage on other wikis
The following other wikis use this file:
- Usage on et.wikipedia.org
.png&oldid=464950264)