File:Exponential Function (AbsReal Part at Infinity) Density.png
Jump to navigation
Jump to search
Size of this preview: 728 × 600 pixels. Other resolutions: 292 × 240 pixels | 583 × 480 pixels | 850 × 700 pixels.
Original file (850 × 700 pixels, file size: 109 KB, MIME type: image/png)
Captions
Captions
Add a one-line explanation of what this file represents
| Description |
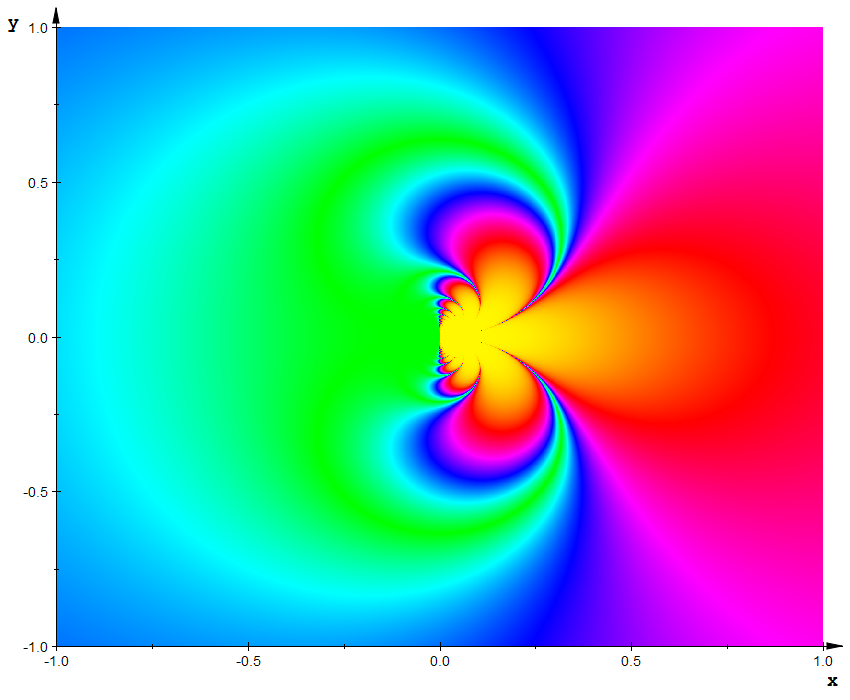
Diagram of the absolute value real part of exponetial function in the complex plane, as the operand approaches infinity. The plot is given by: |
||
| Date | |||
| Source | Own drawing, Plotted in MuPAD | ||
| Author | Inductiveload | ||
| Permission (Reusing this file) |
|

MuPAD Code
[edit]_Density.png&action=edit§ion=1)
f := abs(Re(exp(1/(x+I*y)))):

  ylimit := 1:
  xlimit := 1:
  mesh := 1600:

  hsv := (x, y, z) -> RGB::fromHSV([120+190*arctan(z), 1, 1]):

  cplot := plot::Density(f,
                         x = -xlimit..xlimit,
                         y = -ylimit..ylimit,
                         AntiAliased = TRUE,
                         Mesh = [mesh, mesh],
                         AxesTitleFont = ["Courier New", Bold, 14],
                         TicksLabelFont = ["Arial", 10],
                         FillColorFunction = hsv,
                         YTicksDistance = 0.5,
                         XTicksDistance = 0.5):

  plot(cplot,
       Axes = Frame,
       Width = 8.5*unit::inch,
       Height = 7*unit::inch):
File history
Click on a date/time to view the file as it appeared at that time.
| Date/Time | Thumbnail | Dimensions | User | Comment | |
|---|---|---|---|---|---|
| current | 23:07, 2 October 2016 | | 850 × 700 (109 KB) | Cmdrjameson (talk | contribs) | Compressed with pngout. Reduced by 36kB (25% decrease). |
| 01:40, 22 April 2007 |  | 850 × 700 (146 KB) | Inductiveload (talk | contribs) | {{Information |Description=Diagram of the absolute value real part of exponetial function in the complex plane, as the operand approaches infinity. The plot is given by: ::<math>z=\bigg|\operatorname{Re} \left (\exp \left( \frac{1}{x + i y} \right)\right) |
You cannot overwrite this file.
File usage on Commons
The following page uses this file:
_Density.png&oldid=475437543)