File:Einwohnerentwicklung von Bytom.svg
Jump to navigation
Jump to search

Size of this PNG preview of this SVG file: 800 × 400 pixels. Other resolutions: 320 × 160 pixels | 640 × 320 pixels | 1,024 × 512 pixels | 1,280 × 640 pixels | 2,560 × 1,280 pixels.
Original file (SVG file, nominally 800 × 400 pixels, file size: 37 KB)
Captions
Captions
Add a one-line explanation of what this file represents
Summary
[edit]
| Description |
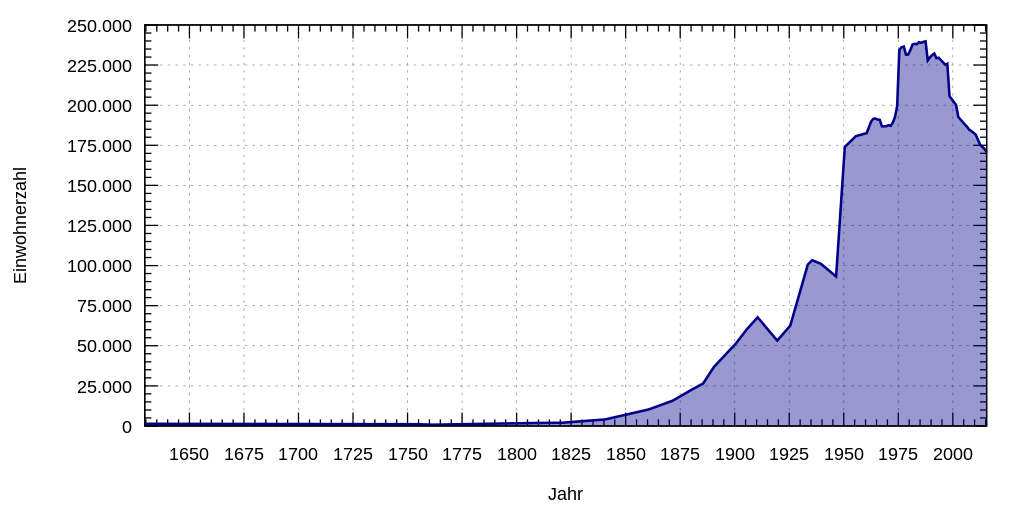
Deutsch: Einwohnerentwicklung von Bytom |
| Source | Own work |
| Author | Summer ... hier! (talk) |
Licensing
[edit]
I, the copyright holder of this work, hereby publish it under the following license:
| This file is made available under the Creative Commons CC0 1.0 Universal Public Domain Dedication. | |
| The person who associated a work with this deed has dedicated the work to the public domain by waiving all of their rights to the work worldwide under copyright law, including all related and neighboring rights, to the extent allowed by law. You can copy, modify, distribute and perform the work, even for commercial purposes, all without asking permission.
|
Gnuplot script to generate this plot
[edit]
This plot was created with Gnuplot by v.
#!/usr/bin/gnuplot
# gnuplot


# Allgemeines zu den Eingabedaten
set timefmt "%d.%m.%Y"     # Zeitangaben in TT.MM.YYYY
set datafile separator ";" # Spaltenseparator


# Allgemeines zur Ausgabe
unset key
set style data lines
set style fill transparent solid 0.4
set grid


# Bereiche/Format/etc X-Achse
set xdata time
set xlabel 'Jahr'
set xrange ['30.06.1629':'30.06.2015']
set xtics '01.01.1600', 60 * 60 * 24 * 365.25 * 25
                      #  xtics in Sekunden
                      # der Beginn der X-Einteilung kann außerhalb xrange
                      # liegen
set mxtics 5
set format x '%Y'     # Beschriftungsformat JJJJ


# Bereiche/Format/etc Y-Achse
set ylabel 'Einwohnerzahl'
set yrange [0:]
set ytics 25000
set decimalsign locale "de_DE.utf8"
set decimal     locale "de_DE.utf8"
set format y  "%'.0f"  # Ausgabeformat
set mytics 5


# Ausgabeformat: Wir erzeugen SVG
# Die Ausgabedaten leiten wir in eine Pipe und sind so bei Namen der
# Ausgabedatei flexibel (Aufruf: Progname.plt > Ausgabe-svg)
set term svg size 800,400 font "Arial,14"
# keine "set output '<Dateiname>'" Angabe


# Erzeugen der Ausgabe
plot '-' using 1:($2) with filledcurves below x1 lt rgb 'dark-blue' lw 2


# Quelle:
# https://de.wikipedia.org/wiki/Einwohnerentwicklung_von_Bytom#cite_note-1
30.06.1629;1377
30.06.1754;1131
30.06.1761;793
30.06.1795;1558
30.06.1800;1707
30.06.1810;1926
30.06.1820;2000
30.06.1840;4079
30.06.1860;10313
30.06.1871;15711
30.06.1880;22810
30.06.1885;26484
30.06.1890;36905
30.06.1900;51404
30.06.1905;60273
30.06.1910;67718
30.06.1919;53238
30.06.1925;62543
30.06.1933;100584
30.06.1935;103332
30.06.1939;101084
30.06.1946;93179 # Volkszählungsergebnis
30.06.1950;173955
30.06.1955;180676
30.06.1960;182578 # Volkszählungsergebnis
30.06.1961;186200
30.06.1962;189700
30.06.1963;191400
30.06.1964;191700
30.06.1965;191041
30.06.1966;190900
30.06.1967;186800
30.06.1968;186800
30.06.1969;186900
30.06.1970;187500
30.06.1971;187151
30.06.1972;189100
30.06.1973;192600
30.06.1974;199400
30.06.1975;234421 # Eingemeindung von Radzionków
30.06.1976;236100
30.06.1977;236500
30.06.1978;231500 # Volkszählungsergebnis
30.06.1979;231600
30.06.1980;234292
30.06.1981;237828
30.06.1982;238172
30.06.1983;238058
30.06.1984;239217
30.06.1985;238925
30.06.1986;239453
30.06.1987;239800
30.06.1988;227917 # Volkszählungsergebnis
30.06.1989;229851
30.06.1990;231206
30.06.1991;232239
30.06.1992;229243
30.06.1993;229605
30.06.1994;228165
30.06.1995;226810
30.06.1996;225287
30.06.1997;225799
30.06.1998;205560 # Ausgliederung von Radzionków
30.06.1999;203795
30.06.2000;201942
30.06.2001;200244
30.06.2002;192597 # Volkszählungsergebnis
30.06.2003;191060
30.06.2004;189535
30.06.2005;187943
30.06.2006;186540
30.06.2007;184765
30.06.2008;183829
30.06.2009;182749
30.06.2010;181617
30.06.2012;175377
30.06.2014;172762 # Wert von [[:de:Bytom#Einwohnerentwicklung]]
30.06.2015;170761 # Wert von [[:pl:Ludność Bytomia]]
e
File history
Click on a date/time to view the file as it appeared at that time.
| Date/Time | Thumbnail | Dimensions | User | Comment | |
|---|---|---|---|---|---|
| current | 19:28, 27 August 2017 | | 800 × 400 (37 KB) | Summer ... hier! (talk | contribs) | +2015 |
| 19:11, 27 August 2017 |  | 800 × 400 (37 KB) | Summer ... hier! (talk | contribs) | +2014 | |
| 18:58, 27 August 2017 |  | 800 × 400 (37 KB) | Summer ... hier! (talk | contribs) | {{Information |Description = {{de|Einwohnerentwicklung von Bytom}} |Source = {{own}} |Author = ~~~ |Date = {{date}} }} == {{int:license-header}} == {{self|Cc-zero}} == Gnuplot script to generate this plot == {{Created wit... |
You cannot overwrite this file.
File usage on Commons
There are no pages that use this file.
File usage on other wikis
The following other wikis use this file:
- Usage on de.wikipedia.org