File:Diagramm Feuchtkugeltemperatur.jpg
Jump to navigation
Jump to search
Size of this preview: 668 × 600 pixels. Other resolutions: 267 × 240 pixels | 535 × 480 pixels | 856 × 768 pixels | 1,153 × 1,035 pixels.
Original file (1,153 × 1,035 pixels, file size: 193 KB, MIME type: image/jpeg)
Captions
Captions
Add a one-line explanation of what this file represents


Summary
[edit]
| Description |
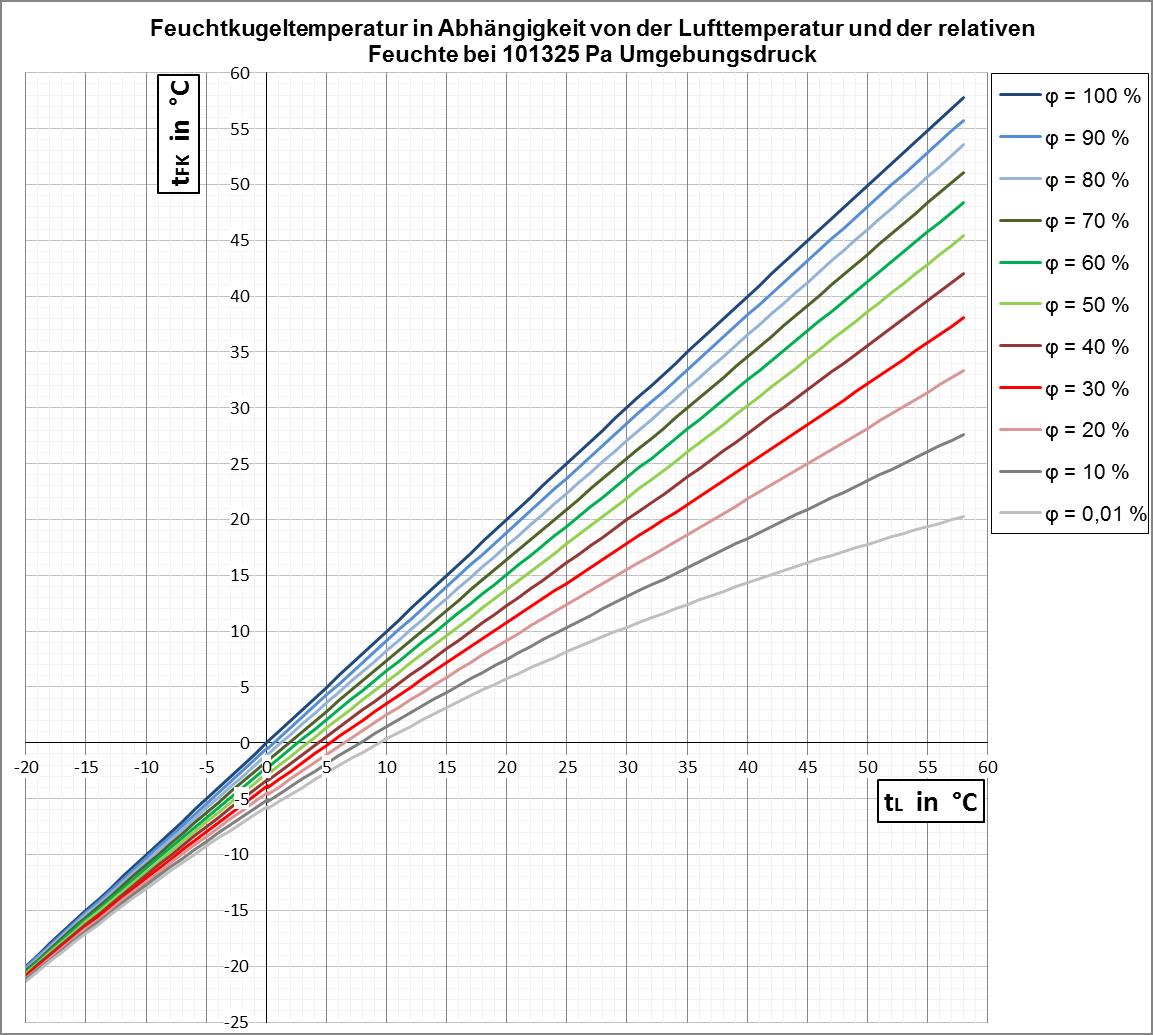
Deutsch: Im Diagramm wird der Verlauf der Temperatur dargestellt, auf die sich feuchte Luft durch adiabatischen Energieentzug abkühlen lässt. Sie fällt mit sinkender Ausgangsfeuchte der Luft. D.h. ein Luftvolumen bestimmter relativer Feuchte kann mehr Wärme abgeben als die gleiche Menge Luft bei gleicher Ausgangstemperatur und gleichem Umgebungsdruck jedoch höherer relativer Feuchte. |
| Date | |
| Source | Own work |
| Author | VinDex |
| Camera location | | View this and other nearby images on: OpenStreetMap |
|---|
Licensing
[edit]
I, the copyright holder of this work, hereby publish it under the following license:
This file is licensed under the Creative Commons Attribution-Share Alike 4.0 International license.
- You are free:
- to share – to copy, distribute and transmit the work
- to remix – to adapt the work
- Under the following conditions:
- attribution – You must give appropriate credit, provide a link to the license, and indicate if changes were made. You may do so in any reasonable manner, but not in any way that suggests the licensor endorses you or your use.
- share alike – If you remix, transform, or build upon the material, you must distribute your contributions under the same or compatible license as the original.
File history
Click on a date/time to view the file as it appeared at that time.
| Date/Time | Thumbnail | Dimensions | User | Comment | |
|---|---|---|---|---|---|
| current | 12:08, 18 August 2017 | | 1,153 × 1,035 (193 KB) | VinDex (talk | contribs) | User created page with UploadWizard |
You cannot overwrite this file.
File usage on Commons
There are no pages that use this file.
File usage on other wikis
The following other wikis use this file:
- Usage on de.wikipedia.org
- Usage on fa.wikipedia.org