File:Diagram fazowy wody.svg
Jump to navigation
Jump to search

Size of this PNG preview of this SVG file: 512 × 427 pixels. Other resolutions: 288 × 240 pixels | 576 × 480 pixels | 921 × 768 pixels | 1,228 × 1,024 pixels | 2,456 × 2,048 pixels.
Original file (SVG file, nominally 512 × 427 pixels, file size: 15 KB)
Captions
Captions
Add a one-line explanation of what this file represents

|
This SVG file contains embedded text that can be translated into your language, using any capable SVG editor, text editor or the SVG Translate tool. For more information see: About translating SVG files. |
Summary
[edit]| Description |
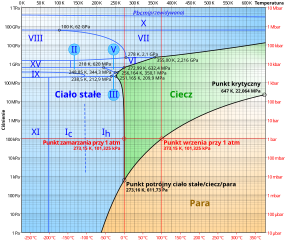
Polski: Diagram fazowy wody w postaci wykresu liniowo-logarytmicznego w zakresie ciśnień od 1 Pa do 1 TPa i temperatury od 0 K do 650 K, stworzony na podstawie danych z: [1] i [2]. Dla najwyższych ciśnień danych doświadczalnych jest niewiele i obszar występowania lodu X oraz granica z przewidywanymi teoretycznie odmianami dla wyższych ciśnień są niepewne. |
|
| Date | ||
| Source |
|
|
| Author |
Original: User:Cmglee Translation and modifications: User:Szczureq |

W3C-validity not checked.
Licensing
[edit]
This file is licensed under the Creative Commons Attribution-Share Alike 3.0 Unported license.
- You are free:
- to share – to copy, distribute and transmit the work
- to remix – to adapt the work
- Under the following conditions:
- attribution – You must give appropriate credit, provide a link to the license, and indicate if changes were made. You may do so in any reasonable manner, but not in any way that suggests the licensor endorses you or your use.
- share alike – If you remix, transform, or build upon the material, you must distribute your contributions under the same or compatible license as the original.
File history
Click on a date/time to view the file as it appeared at that time.
| Date/Time | Thumbnail | Dimensions | User | Comment | |
|---|---|---|---|---|---|
| current | 13:49, 18 January 2014 | | 512 × 427 (15 KB) | Szczureq (talk | contribs) | Oznaczenie wysokociśnieniowej fazy, przewidywanej teoretycznie, zamienione z "lód XI (heksagonalny)" na oznaczenie jej grupy przestrzennej. Poprawa ustawienia części opisów, tłumaczenie opisu wewnątrz pliku, drobne techniczne. |
| 13:55, 9 March 2012 |  | 512 × 427 (15 KB) | Szczureq (talk | contribs) |
You cannot overwrite this file.
File usage on Commons
There are no pages that use this file.