File:Delayed human NE transition is associated with a shorter cell cycle.jpg

Original file (2,922 × 4,169 pixels, file size: 1.4 MB, MIME type: image/jpeg)
Captions
Captions
Summary
[edit]
| Description |
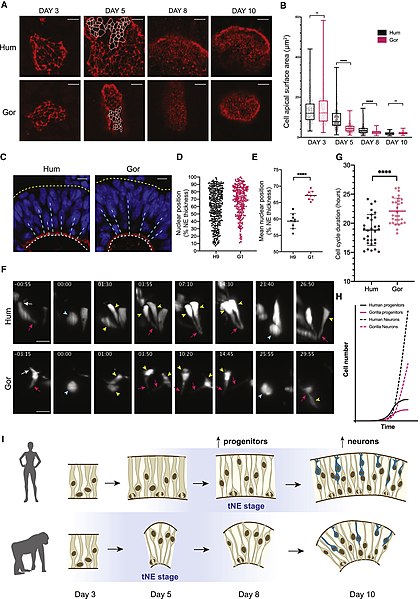
English: "(A) Immunofluorescent staining for ZO1 on the surface of apical lumens of human (H9) and gorilla (G1) organoids revealing apical surface areas of individual neural progenitor cells at days 3, 5, 8, and 10. Perimeters of some individual cells of day 5 organoids are delineated in white. Scale bar, 10 μm.
(B) Quantification of the surface area of individual human (H9) and gorilla (G1) NPCs between day 3 and 10 showing a gradual reduction in apical surface area over time in both species by 7-fold. Note gorilla cells are more constricted than human during the transitioning period from days 5 to 8. Measurements were performed on delineated ZO1 cell perimeters as demonstrated in (A). Mean apical surface area/cell: human day 3 = 13.82 μm2, gorilla day 3 = 14.80 μm2, human day 8 = 3.86 μm2, gorilla day 8 = 2.46 μm2, human day 10 = 1.92 μm2, gorilla day 10 = 2.13 μm2, and human and gorilla day 5 are reported in Figure 2C. ∗∗∗∗p < 0.0001, per time point Mann-Whitney U, two-tailed, n (day 3 human) = 164 cells from 8 organoids and 2 batches, n (day 3 gorilla) = 176 cells from 8 organoids and 2 batches, n (day 8 human) = 171 cells from 4 organoids of 1 batch, n (day 8 gorilla) = 55 cells from 2 organoids of 1 batch, n (day 10 human) = 68 cells from 3 organoids of 1 batch, n (day 10 gorilla) = 74 cells from 4 organoids of 1 batch, and n (day 5) = reported in Figure 2C. (C) Representative immunofluorescence images showing the position of nuclei (DAPI, blue) of neural progenitor cells relative to the apical surface (ZO1, red) in neuroepithelial buds of day 5 human (H9) and gorilla (G1) organoids. Dashed lines in white and yellow represent apical and basal surfaces of the neuroepithelial bud respectively. Some nuclear distances from the apical surface are shown as dashed lines in cyan, and as quantified in (D) and (E). Note the more basal distribution of nuclei in gorilla tissue. Scale bar, 10 μm. (D and E) Quantification of the position of nuclei of human (H9) and gorilla (G1) neural progenitor cells relative to the apical surface as a percentage of apicobasal neuroepithelial (NE) thickness. Measurements were performed on images as shown in (C) (D) Quantification of positions of individual cells showing gorilla progenitors located more basally. (E) Mean nuclear position per neuroepithelial bud showing gorilla cells located significantly more basal. Mean nuclear position: human = 59.34%, gorilla = 67.14%. ∗∗∗∗p < 0.0001, Student’s t test, unpaired, two-tailed, n (human) = 335 nuclei from 9 organoids and 3 independent batches, and n (gorilla) = 307 nuclei from 9 organoids and 3 independent batches. Error bars are SD. (F) Still frames of live imaging of neural progenitor cells sparsely labeled with GFP (grayscale) in human (H9) (Video S2) and gorilla (G1) (Video S3) organoids covering an entire cell cycle between day 3 and 4.5. Note the presence of neural progenitor cells with columnar NE morphology in both species prior to the first division (00:00, reference time point) and loss of basal process (white arrowheads) during cell mitosis (blue arrowheads). Note daughter cells (yellow arrowheads) show thicker apical processes (magenta arrowheads) in human relative to the more constricted morphology of gorilla apical processes. Time shown in hours:minutes. (G) Quantification of cell cycle duration of human (H9) and gorilla (G1) neural progenitor cells imaged between days 3 and 5 showing significantly longer cell cycles in gorilla. Mean cell cycle length: human = 18.83 h, gorilla = 22.10. ∗∗∗∗p < 0.0001, Mann-Whitney U, two-tailed, n (human) = 30 cells from 5 independent batches, n (gorilla) = 29 cells from 5 independent batches. Error bars are SD. (H) Growth curve modeling of the predicted effect that differences in cell cycle length, as measured in (G), would have on human and gorilla progenitor numbers (bold lines) and on neuron numbers (dashed lines) with a 1.9-fold expected increase in human for both. (I) Schematic summarizing the morphological changes in neural progenitor cells. Progenitor cells of apes undergo a gradual transition from NE to tNE to neurogenic RG cells. Nonhuman ape cells show tNE morphologies (blue background) earlier than human cells, which show shorter cell cycles leading to increased neuron numbers." |
| Date | |
| Source | https://www.cell.com/cell/fulltext/S0092-8674(21)00239-7 |
| Author | Authors of the study: Silvia Benito-Kwiecinski, Stefano L. Giandomenico, Magdalena Sutcliffe, Gregory A. Wray, Kate McDole, Madeline A. Lancaster |
Licensing
[edit]
- You are free:
- to share – to copy, distribute and transmit the work
- to remix – to adapt the work
- Under the following conditions:
- attribution – You must give appropriate credit, provide a link to the license, and indicate if changes were made. You may do so in any reasonable manner, but not in any way that suggests the licensor endorses you or your use.
File history
Click on a date/time to view the file as it appeared at that time.
| Date/Time | Thumbnail | Dimensions | User | Comment | |
|---|---|---|---|---|---|
| current | 13:17, 29 April 2021 | | 2,922 × 4,169 (1.4 MB) | Prototyperspective (talk | contribs) | Uploaded a work by Authors of the study: Silvia Benito-Kwiecinski, Stefano L. Giandomenico, Magdalena Sutcliffe, Gregory A. Wray, Kate McDole, Madeline A. Lancaster from https://www.cell.com/cell/fulltext/S0092-8674(21)00239-7 with UploadWizard |
You cannot overwrite this file.
File usage on Commons
There are no pages that use this file.